


1. Ethylene Oxide Emissions
1.1 What Is Ethylene Oxide (EtO)?
Ethylene oxide (EtO) is a flammable, colorless, and reactive gas. It is a synthetic chemical created as a byproduct of human (i.e., anthropogenic) activities or generated as a natural metabolic product of ethylene by microbes, plants, and animals, including humans (i.e., biogenic).
EtO is one of 188 listed hazardous air pollutants (HAP) covered under Section 112 of the Clean Air Act (CAA). The World Health Organization, the United States Environmental Protection Agency (USEPA), the United States Department of Health and Human Services (HHS), and other health agencies have categorized EtO as a human carcinogen.
EtO is produced and used for various purposes:
- to manufacture other chemicals that are used to make a range of products (e.g., antifreeze, textiles, plastics, detergents, and adhesives)
- to sterilize a wide range of products that are not compatible with other methods of industrial sterilization such as single-use medical devices, custom surgical procedure kits, equipment with integrated electronics, wound care dressings, and other pharmaceutical and biologics applications
- to fumigate and eradicate pests from some foods (e.g., spices)
1.1.1 Why Was This Guide Developed?
EtO is a human carcinogen. Sources of EtO include both large industrial facilities and smaller-scale commercial users of EtO that may be located close to residences, schools, and other nearby workplaces. People also have environmental justice (EJ) concerns about the manufacture and use of EtO in their communities.
In 2016, the USEPA issued a toxicological assessment of EtO that classified it as “carcinogenic to humans” and found it to be a more potent carcinogen via inhalation than previously understood (see Section 2.4 for more information) (USEPA 2016b). EtO in the environment is a result of emissions from the production and processing of industrial chemicals, use of sterilizers, and other possible anthropogenic and natural sources, many of which are still being studied. Based on the updated EtO assessment, USEPA analyses show that EtO emissions may pose a greater public health concern than previously realized (USEPA 2016b).
This guide is intended to help states and other interested parties improve their management of EtO and communicate better about EtO. This guide covers the following topics:
- Properties and effects of EtO
- Regulatory Framework
- Uses and Sources of EtO
- Emissions Control of EtO
- Sampling, Measurements, and Analysis of EtO
- Community Engagement Resources
The Interstate Technology and Regulatory Commission (ITRC) EtO Team has compiled information from a broad range of interested parties, including state and federal governments and industry, to develop this interactive guide. This resource is intended to inform interested parties about important regulatory developments; technical issues surrounding sampling, measurements, and analysis; and effective communication of EtO-related issues. The ITRC acknowledges that there are various viewpoints and expects to update this content as the science continues to develop.
1.1.2 Background EtO
EtO has been detected in many ambient air samples in both urban and rural settings. Currently, the definition of background EtO varies among state, federal, and local entities. For example, background EtO can be defined as EtO detected away from urban areas and emissions sources. USEPA defines background EtO as EtO in the outdoor air that is not clearly linked to a particular industrial facility (USEPA 2023a, USEPA 2023i). Please refer to state resources to verify how background EtO is defined in your area. In this guide, background EtO is defined as EtO in ambient air that is not clearly linked to any known or suspected source, such as a chemical plant or commercial sterilizer. Challenges with EtO sampling and data interpretation are explained further in Section 6
Interactive EtO Guidance Roadmap.
Click on a hexagon to be moved to that section.

2. Introduction
2.1 Physical and Chemical Properties
EtO is a colorless, flammable, and reactive gas with a sweet odor. Most people can only smell it once the concentration is above thresholds associated with acute effects. Therefore, odor is not a reliable indicator of exposure to EtO (California Department of Health Services 1991). It is highly soluble in water and possesses a high vapor pressure.
The EtO molecular structure is shown in Figure 1. It is composed of an oxygen atom (red) that is covalently bound to each of two carbon atoms (gray). Together, these form a three-membered ring of the chemical epoxide group. The carbon atoms are also each covalently linked to two hydrogen molecules (white). The epoxide group is reactive and leads to the formation of chemical products as well as DNA and protein adducts. Table 1 lists the physical and chemical properties of EtO.
2.2 Production and Industrial Use
EtO is both a natural substance and a synthetic substance. The quantity of EtO produced naturally by the metabolism of ethylene in microbes, plants, and animals (including humans) is currently unknown (see the appendix for more information). It can emanate from water-logged soil, manure, and sewage sludge where it may be produced by microbial activity (Liteplo, Meek, and Lewis 2003).
Synthetic EtO is primarily produced through the oxidation of ethylene with a silver catalyst. In 2019, the United States produced 2.92 million metric tons of EtO, and the total production capacity is expected to increase due to market demand (ACC 2019a). More than 97% of the amount produced is used as a chemical intermediate for the production of other chemicals, such as (mono)ethylene glycol (MEG), ethoxylates, ethanolamines, glycol ethers, and polyether polyols (ACC 2019a). Less than 1% of produced EtO is used as a fumigant, to sterilize food (spices) and cosmetics, and to sterilize medical and surgical equipment and plastic devices that cannot be sterilized by heat or steam. EtO is widely used at both commercial sterilization facilities and hospitals and is an effective sterilant gas that can penetrate packaging and destroy bacteria and viruses (ATSDR 2022d).
EtO is a raw material converted through manufacturing into a variety of products used in everyday life (Dever et al. 2000). The manufacturing process converts EtO into inert materials that are considered safe for consumers when used as intended. For example, a significant portion (34%) of all EtO that is used in manufacturing is converted into MEG for use as an antifreeze. The remainder goes to broader glycols production (ACC 2019a).
Approximately 15% of EtO used in manufacturing is used to produce various ethoxylate surfactants/detergents (captured within the ethoxylates category) and other derivatives, including polyethylene glycols, glycol ethers, ethanolamines, polyurethane foam, and mixed polyglycols (ACC 2022).
The products that are made from EtO raw material are used in many commercial and industrial applications, including the following (ACC 2019b):
- adhesives, paints, and inks
- appliance insulation
- architectural coatings
- automotive and architectural glass
- automotive seating
- carpet backing and furniture cushioning
- commercial and residential roofing
- hydraulic and brake fluids
- lubricants
- metal and industrial cleaning
- motor vehicle antifreezes
- natural gas and oil industry products
- personal care products
- pharmaceuticals
- polyester
- polyether polyols
- polymers and resins
- safety glass
- textile additives
2.2.1 Additional Uses
Various derivatives of EtO are used as precursors to or as final products in applications such as CO2 scrubbing, water treatment, solvents, plasticizers, wetting agents, emulsifiers, and dispersants (Faveere et al. 2021). Ethoxylation derivatives, called demulsifiers, are used in corn oil extraction processes (ACC 2023b). EtO is also used in the corn refining industry to produce industrial hydroxyethylated starch that is widely used in surface sizing and coating paper (Corn Refiners Association 2006). EtO derivatives are also used as raw materials in the manufacture of lithium-ion batteries installed in electric vehicles (ACC 2023a).
2.3 Emission and Fate
The environmental transport of EtO is primarily through the air as a gas at atmospheric pressure and room temperature. In the air, EtO undergoes measurable rates of degradation. Oxidation via hydroxyl radical formation is the most common degradation pathway into carbon dioxide and water. The estimated half-life of this reaction ranges from 2 to 5 months (ATSDR 2022d). Laboratory estimates of the half-life of other reactions of EtO in the atmosphere vary widely. The reaction with the hydroxyl radical may have a half-life of 1 to 12 months (Liteplo, Meek, and Lewis 2003), and ultraviolet-catalyzed oxidation in the presence of oxygen and nitrogen dioxide may occur (ATSDR 2022d).
Figure 2 illustrates the environmental fate of released EtO. Regardless of the source of EtO, air is the predominant environmental medium to which it partitions and persists. Releases to water and soil (e.g., spill) are less frequent and are minor contributors of EtO to the environment. Evaporation of EtO from soil and water are not expected to substantially contribute to the air/ambient environment (ATSDR 2022d, Conway et al. 1983).

Figure 2. Environmental fate of EtO with information on environmental half-lives.
Notes: Arrows are not to scale. Solid arrows represent the major environmental air releases for EtO accumulation. Hatched arrows indicate minor environmental water and soil releases where potential EtO accumulation does not persist. In water and soil, EtO is hydrolyzed (biodegrades) to (mono)ethylene glycol (MEG) or to MEG and ethylene chlorohydrin (ECH) in salt water. Half-life sources: ^ATSDR (2022a), *Conway and colleagues (1983).
Source: Joanna Klapacz/DOW. Used with permission.
Toxics Release Inventory Reported EtO Emissions
In 2021, 155,498 pounds of EtO was emitted to air (USEPA 2022j).
Most emissions of EtO occur during production, usage, storage, and handling in commercial and industrial settings. Such emissions originate from stacks and vents and from fugitive sources (such as building openings and equipment leaks) at regulated and unregulated facilities The USEPA has two inventories, the Toxics Release Inventory (TRI) and the National Emissions Inventory (NEI), which collect data from industry-reported emissions of EtO to air (USEPA 2023v, 2023ag). These two inventories have different reporting criteria and have not always required reporting of EtO data from all sectors. For facilities common to both TRI and NEI, air emissions may be the same or differ based on the criteria. NEI includes EtO emissions at facilities that do not report EtO emissions to TRI. NEI also includes EtO emissions not associated with individual facilities, referred to as nonpoint emissions.
EtO is highly soluble in water but may volatilize from water due to its high vapor pressure. Conway and colleagues (1983) reported that about 95% of EtO mixed with water volatilizes within four hours and thus would not be prevalent in environmental water sources. EtO in water also degrades via hydrolysis and reaction with anions, leading to the formation of glycols and halogenated alcohols. These degrade into simpler molecules such as carbon dioxide and water. The half-lives of these reactions range from a few hours to less than 15 days, depending on environmental conditions. EtO also undergoes aerobic and anaerobic biodegradation, with a half-life in wastewater treatment systems of about 20 days (ATSDR 2022d).
Due to its chemical and physical properties, EtO in soil is expected to volatilize, migrate through the soil, or be removed by runoff during rainstorms (ATSDR 2022d). Further, EtO in soil is expected to undergo hydrolysis and biodegradation, similar to EtO in water bodies, as well as to react with mineral surfaces, although again, studies are lacking (ATSDR 2022d) (see Figure 2).
Some industrial sources discharge EtO in wastewater. The TRI shows 2,665 pounds of EtO were discharged to surface waters in 2019. This includes releases to wastewater treatment and publicly owned treatment works. Some industrial sources release EtO to the soil. The TRI shows 30,723 pounds of EtO were released to soils in 2019. In addition, although EtO is not approved as a soil fumigant, soils may be exposed via rainfall where EtO is entrained from the rain and deposited on the ground or via uncontrolled discharges of liquid wastes (ATSDR 2022d).
2.1 Physical and Chemical Properties
EtO is a colorless, flammable, and reactive gas with a sweet odor. Most people can only smell it once the concentration is above thresholds associated with acute effects. Therefore, odor is not a reliable indicator of exposure to EtO (California Department of Health Services 1991). It is highly soluble in water and possesses a high vapor pressure.
The EtO molecular structure is shown in Figure 1. It is composed of an oxygen atom (red) that is covalently bound to each of two carbon atoms (gray). Together, these form a three-membered ring of the chemical epoxide group. The carbon atoms are also each covalently linked to two hydrogen molecules (white). The epoxide group is reactive and leads to the formation of chemical products as well as DNA and protein adducts. Table 1 lists the physical and chemical properties of EtO.
Table 1. Physical and chemical properties of EtO
| Molecular Formula | C2H4O |
| Molecular Weight | 44.053 grams/mole |
| CAS # | 75-21-8 |
| Melting Point | −111.6°C |
| Boiling Point | 10.4°C |
| Density at 10°C | 0.8824 |
| Relative Density | 0.9 |
| Vapor Pressure at 25°C | 1,255 mm Hg (146 kPa at 20°C, 1.46 atm) |
| Henry’s Law Constant at 25°C | 1.48 × 10⁻⁴ atm-m3/mole |
| Water Solubility at 20°C | 1 × 10⁶ mg/liter |
| Odor Thresholds | Water: 140 mg/liter Air: 787 mg/m3 (433 ppm) |
| Autoignition Temperature | 429°C |
| Flashpoint | < −18°C |
| Flammability / Explosive Limits | Lower: 3% Upper: 100% |
Sources: ATSDR (2022a), OSHA (2023b), USEPA (2020c), and sources therein.
Notes: atm = standard atmospheric pressure, CAS # = Chemical Abstracts Service Number, kPa = kilopascal, m = meter, mg = milligrams, mm Hg = millimeters of mercury, ppm = parts per million.
2.2 Production and Industrial Use
EtO is both a natural substance and a synthetic substance. The quantity of EtO produced naturally by the metabolism of ethylene in microbes, plants, and animals (including humans) is currently unknown (see the appendix for more information). It can emanate from water-logged soil, manure, and sewage sludge where it may be produced by microbial activity (Liteplo, Meek, and Lewis 2003).
Synthetic EtO is primarily produced through the oxidation of ethylene with a silver catalyst. In 2019, the United States produced 2.92 million metric tons of EtO, and the total production capacity is expected to increase due to market demand (ACC 2019a). More than 97% of the amount produced is used as a chemical intermediate for the production of other chemicals, such as (mono)ethylene glycol (MEG), ethoxylates, ethanolamines, glycol ethers, and polyether polyols (ACC 2019a). Less than 1% of produced EtO is used as a fumigant, to sterilize food (spices) and cosmetics, and to sterilize medical and surgical equipment and plastic devices that cannot be sterilized by heat or steam. EtO is widely used at both commercial sterilization facilities and hospitals and is an effective sterilant gas that can penetrate packaging and destroy bacteria and viruses (ATSDR 2022d).
EtO is a raw material converted through manufacturing into a variety of products used in everyday life (Dever et al. 2000). The manufacturing process converts EtO into inert materials that are considered safe for consumers when used as intended. For example, a significant portion (34%) of all EtO that is used in manufacturing is converted into MEG for use as an antifreeze. The remainder goes to broader glycols production (ACC 2019a).
Approximately 15% of EtO used in manufacturing is used to produce various ethoxylate surfactants/detergents (captured within the ethoxylates category) and other derivatives, including polyethylene glycols, glycol ethers, ethanolamines, polyurethane foam, and mixed polyglycols (ACC 2022).
The products that are made from EtO raw material are used in many commercial and industrial applications, including the following (ACC 2019b):
- adhesives, paints, and inks
- appliance insulation
- architectural coatings
- automotive and architectural glass
- automotive seating
- carpet backing and furniture cushioning
- commercial and residential roofing
- hydraulic and brake fluids
- lubricants
- metal and industrial cleaning
- motor vehicle antifreezes
- natural gas and oil industry products
- personal care products
- pharmaceuticals
- polyester
- polyether polyols
- polymers and resins
- safety glass
- textile additives
2.2.1 Additional Uses
Various derivatives of EtO are used as precursors to or as final products in applications such as CO2 scrubbing, water treatment, solvents, plasticizers, wetting agents, emulsifiers, and dispersants (Faveere et al. 2021). Ethoxylation derivatives, called demulsifiers, are used in corn oil extraction processes (ACC 2023b). EtO is also used in the corn refining industry to produce industrial hydroxyethylated starch that is widely used in surface sizing and coating paper (Corn Refiners Association 2006). EtO derivatives are also used as raw materials in the manufacture of lithium-ion batteries installed in electric vehicles (ACC 2023a).
2.3 Emission and Fate
The environmental transport of EtO is primarily through the air as a gas at atmospheric pressure and room temperature. In the air, EtO undergoes measurable rates of degradation. Oxidation via hydroxyl radical formation is the most common degradation pathway into carbon dioxide and water. The estimated half-life of this reaction ranges from 2 to 5 months (ATSDR 2022d). Laboratory estimates of the half-life of other reactions of EtO in the atmosphere vary widely. The reaction with the hydroxyl radical may have a half-life of 1 to 12 months (Liteplo, Meek, and Lewis 2003), and ultraviolet-catalyzed oxidation in the presence of oxygen and nitrogen dioxide may occur (ATSDR 2022d).
Figure 2 illustrates the environmental fate of released EtO. Regardless of the source of EtO, air is the predominant environmental medium to which it partitions and persists. Releases to water and soil (e.g., spill) are less frequent and are minor contributors of EtO to the environment. Evaporation of EtO from soil and water are not expected to substantially contribute to the air/ambient environment (ATSDR 2022d, Conway et al. 1983).
Toxics Release Inventory Reported EtO Emissions
In 2021, 155,498 pounds of EtO was emitted to air (USEPA 2022j).
Most emissions of EtO occur during production, usage, storage, and handling in commercial and industrial settings. Such emissions originate from stacks and vents and from fugitive sources (such as building openings and equipment leaks) at regulated and unregulated facilities The USEPA has two inventories, the Toxics Release Inventory (TRI) and the National Emissions Inventory (NEI), which collect data from industry-reported emissions of EtO to air (USEPA 2023v, 2023ag). These two inventories have different reporting criteria and have not always required reporting of EtO data from all sectors. For facilities common to both TRI and NEI, air emissions may be the same or differ based on the criteria. NEI includes EtO emissions at facilities that do not report EtO emissions to TRI. NEI also includes EtO emissions not associated with individual facilities, referred to as nonpoint emissions.
EtO is highly soluble in water but may volatilize from water due to its high vapor pressure. Conway and colleagues (1983) reported that about 95% of EtO mixed with water volatilizes within four hours and thus would not be prevalent in environmental water sources. EtO in water also degrades via hydrolysis and reaction with anions, leading to the formation of glycols and halogenated alcohols. These degrade into simpler molecules such as carbon dioxide and water. The half-lives of these reactions range from a few hours to less than 15 days, depending on environmental conditions. EtO also undergoes aerobic and anaerobic biodegradation, with a half-life in wastewater treatment systems of about 20 days (ATSDR 2022d).
Due to its chemical and physical properties, EtO in soil is expected to volatilize, migrate through the soil, or be removed by runoff during rainstorms (ATSDR 2022d). Further, EtO in soil is expected to undergo hydrolysis and biodegradation, similar to EtO in water bodies, as well as to react with mineral surfaces, although again, studies are lacking (ATSDR 2022d) (see Figure 2).
Some industrial sources discharge EtO in wastewater. The TRI shows 2,665 pounds of EtO were discharged to surface waters in 2019. This includes releases to wastewater treatment and publicly owned treatment works. Some industrial sources release EtO to the soil. The TRI shows 30,723 pounds of EtO were released to soils in 2019. In addition, although EtO is not approved as a soil fumigant, soils may be exposed via rainfall where EtO is entrained from the rain and deposited on the ground or via uncontrolled discharges of liquid wastes (ATSDR 2022d).
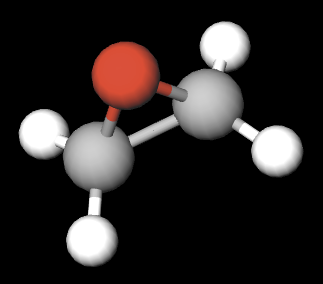
Figure 1. EtO compound molecule.
Source: Kristi Beck/Maricopa County Air Quality Department (created at MolView.org). Used with permission.
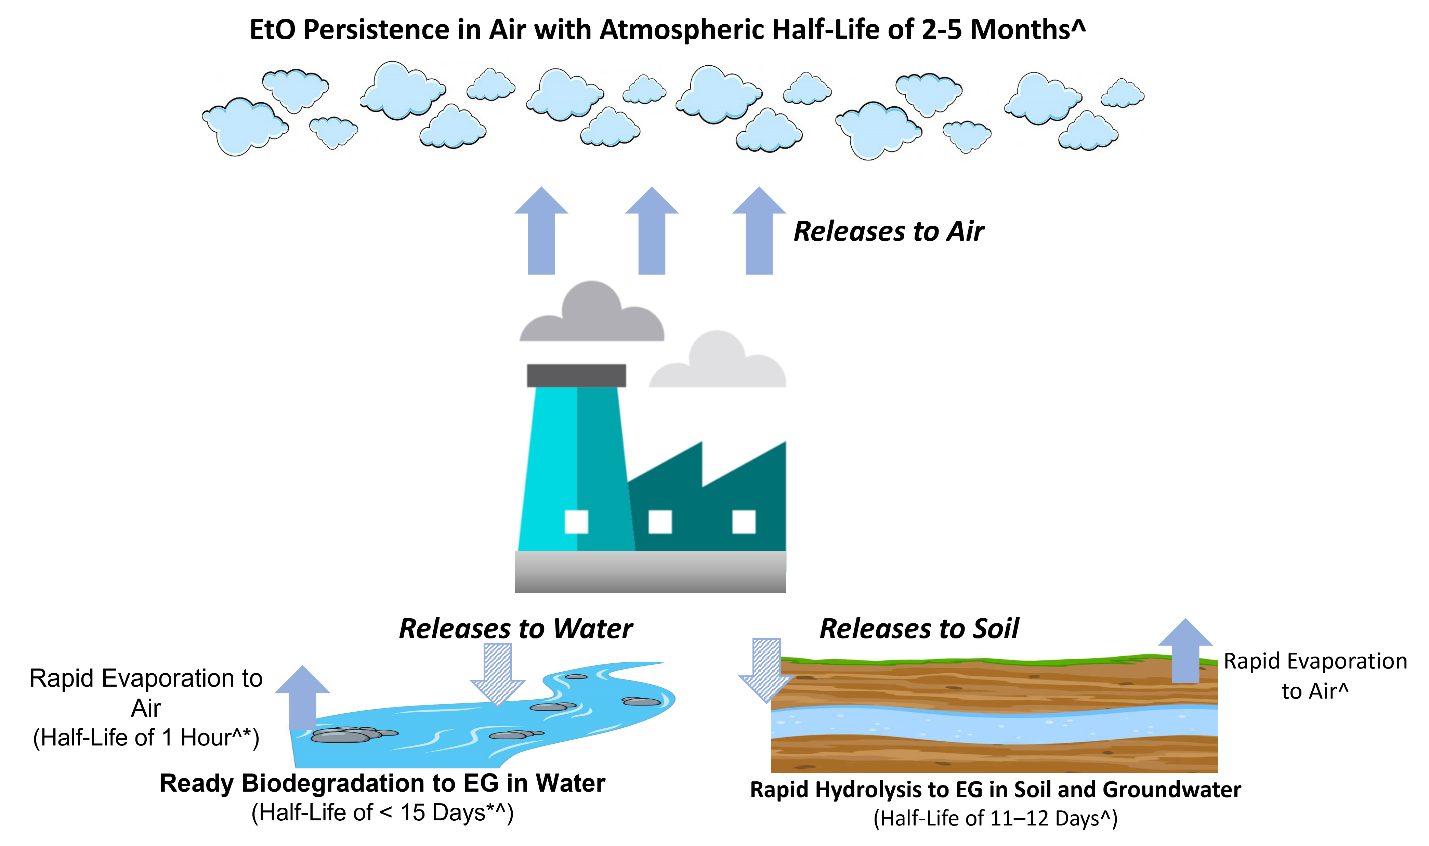
Figure 2. Environmental fate of EtO with information on environmental half-lives.
Notes: Arrows are not to scale. Solid arrows represent the major environmental air releases for EtO accumulation. Hatched arrows indicate minor environmental water and soil releases where potential EtO accumulation does not persist. In water and soil, EtO is hydrolyzed (biodegrades) to (mono)ethylene glycol (MEG) or to MEG and ethylene chlorohydrin (ECH) in salt water. Half-life sources: ^ATSDR (2022a), *Conway and colleagues (1983).
Source: Joanna Klapacz/DOW. Used with permission.
2.4 Health Effects
Inhalation is the primary EtO exposure route. Occupational exposure to EtO is possible for people working where EtO is produced or used, such as chemical plants or commercial or industrial sterilizing facilities. These occupational exposures may be higher than exposures for people not working with EtO. Additionally, individuals who live near facilities that release EtO may be exposed. Biomarker data for EtO exposure for the U.S. general population have been monitored by the United States Centers for Disease Control and Prevention (CDC) in the National Health and Nutrition Examination Survey (NHANES) cycles 2013–2014 and 2015–2016 and are publicly available (CDC 2022). The information presented in these data are based on hemoglobin biomarker levels (i.e., hemoglobin adducts). Lifestyle choices may also contribute to higher total EtO exposure and adduct levels (e.g., higher levels in smokers vs. lower levels in nonsmokers) (Kirman et al. 2021). Due to its chemical and physical properties, EtO is expected to persist in air for 2–5 months but not in other environmental media, such as soil and water (ATSDR 2022d). Current data suggest that EtO would not remain in or on food or dissolved in water long enough to be ingested.
2.4.1 Short-term Health Effects
High concentrations of EtO can cause noncancer health effects. Studies of workers exposed to high concentrations of EtO in the air for short or long (chronic) periods of time have reported respiratory, eye, and skin irritation; headaches; memory loss; numbness; nausea; and vomiting. Studies of workers routinely exposed to EtO above occupational exposure limits (OELs) in the air have reported evidence of cellular changes and effects on the blood (ATSDR 2022a). More information on OELs can be found in the National Institute for Occupational Safety and Health (NIOSH) pocket guide to chemical hazards (NIOSH 2019). More studies are needed to better understand the impacts of EtO exposure on pregnant people (ATSDR 2022c). Laboratory animal studies show associations between higher-dose EtO exposures and reproductive and developmental effects, including fetal loss (ATSDR 2022d). The short-term (acute, 1-hour) estimated concentrations of EtO in ambient air are ordinarily well below concentrations that may cause immediately serious or long-lasting noncancer health effects (ATSDR 2022a).
2.4.2 Long-term Health Effects
The HHS has classified EtO as “known to be a human carcinogen” (HHS 2021). The USEPA has characterized EtO as “carcinogenic to humans” by the inhalation exposure route (USEPA 2016b). The International Agency for Research on Cancer (IARC) has designated EtO as “carcinogenic to humans (Group 1)” (IARC 1987, 2012). EtO is also known to be mutagenic in a large number of living organisms and to induce chromosome damage (USEPA 2016b). Occupational studies indicate that humans with long-term (years or decades) cumulative exposure to elevated EtO concentrations have an increased risk of lymphohematopoietic cancers, including non-Hodgkin’s lymphoma, myeloma, and lymphocytic leukemia (Steenland, Stayner, and Deddens 2004, Steenland et al. 2003). USEPA’s 2016 Integrated Risk Information System (IRIS) assessment concluded that long-term exposure to elevated EtO concentrations increased the risk of breast cancer in women (ATSDR 2022a, Steenland, Stayner, and Deddens 2004, Steenland et al. 2003). Similar cancers were found in animal studies (ATSDR 2022a). The Texas Commission on Environmental Quality (TCEQ) concluded that EtO is “likely to be carcinogenic to humans,” particularly for lymphohematopoietic cancers, but that there was insufficient evidence to link EtO with human breast cancer (TCEQ 2020a).
The USEPA IRIS program used available studies of workers to develop a cancer risk value for inhalation exposure to EtO to be applied at lower levels more typical of outdoor air concentrations (USEPA 2023r). A cancer risk value relates the concentration in the air to the risk of developing cancer in a lifetime. This value was reassessed and updated in 2016. The development of inhalation unit risk values requires assumptions, interpretations of the data, and judgment, which can lead to different conclusions. For example, the TCEQ and the California Environmental Protection Agency (California EPA) have developed their own cancer risk values for EtO. On December 21, 2022, the USEPA issued a final decision to continue to use the USEPA IRIS value for federal regulation because the USEPA IRIS value was developed using an approach supported by the Science Advisory Board for selecting dose-response values for the CAA Section 112(f)(2) risk reviews (USEPA 2022j).
This guide is meant to be informative and is intended to present a variety of available information. Thus, this guide presents resources developed by state and federal agencies. Although these approaches may differ, the risk assessments used to support federal regulations are often based on the USEPA IRIS risk value for EtO.
Links to examples of the different approaches to deriving lifetime estimated cancer risk values are provided below:
- USEPA (USEPA 2016a)
- California EPA (draft document currently under review) (California EPA 2023)
- TCEQ (TCEQ 2020b)

3. Regulatory Framework
3.1 EtO History
In 1859, French chemist Charles-Adolphe Wurtz first synthesized EtO. Since then, it has been used in many different industrial and commercial processes. Commercial production of EtO began in 1914 and achieved industrial importance during World War I as a precursor to the coolant MEG and the chemical weapon mustard gas (ACS 2019, NWE 2017).
In 1931, French chemist Theodore Lefort patented an efficient direct oxidated method of preparing EtO. In 1937 Union Carbide opened a processing plant using this method (NWE 2017).
In 1938, American Chemist Lloyd Hall received a patent for sterilization by EtO for the preservation of spices (Figure 3). By 1940, this process was used in a vacuum chamber for spices and other food preservatives (African American Registry 2022).
By 1948, the health effects experienced by those exposed to EtO had been observed, and a study found that it potentially causes cancer (USEPA 2016b). Despite this study, EtO became a common sterilizer of medical instruments by 1950.
In 1985 USEPA, through IRIS, first quantified the relationship between the concentration of EtO in air and the potential risk of cancer and estimated the cancer unit risk (Gray, Harris, and Santodonato 1985). In 1986, Congress approved the Emergency Planning and Community Right-To-Know Act requiring industry to report the storage, use, and release of hazardous substances. USEPA compiles an annual TRI that includes EtO and is available to the public. California declared EtO as a human carcinogen in 1987 (USEPA 2023ag). In 1990, USEPA listed EtO as one of the 188 HAP.
During 2003 and 2004, NIOSH reported that workers exposed to high levels of EtO may be at an increased risk for breast cancer and lymphomas (CDC 2020). In 2006 USEPA released a first draft of its scientific review that concluded EtO was a human carcinogen. Based on the additional scientific data that became available and updates to data evaluation methods, USEPA published a new IRIS assessment in 2016 (USEPA 2016b). The new assessment reclassified EtO from a “probable carcinogen” to “carcinogenic to humans” and indicated a greater cancer potency as shown by the revised inhalation unit risk estimate (USEPA 2016b).

Figure 3. Spices.
Source: Microsoft Stock Images.
3.2 What Prompted USEPA Action to Revise EtO Regulations?
As discussed in Section 2.4, the USEPA IRIS published the final toxicological assessment of EtO in 2016 (USEPA 2016b).
Follow these links for the results of AirToxScreen (formerly known as NATA)
For more information on AirToxScreen, see Section 4.2.
USEPA first used the new IRIS value to estimate EtO risks across the United States in the National Air Toxics Assessment (NATA) released in August 2018. NATA provides screening-level estimates of cancer risk and noncancer health hazard from inhalation of air toxics. These screening-level estimates can be used to identify where additional review and refined risk assessments are warranted. The NATA released in 2018, which used 2014 facility data, identified several areas in the United States as potentially having cancer risks greater than 100 in 1 million (1×10⁻⁴) from long-term exposure (70 years) to EtO. These areas had not been identified in previous versions of NATA because the 1985 inhalation unit risk estimate had been based on rodent cancer data available at the time. An increased cancer risk estimate of 100 in 1 million (1×10⁻⁴) over a lifetime is ordinarily the upper end of the range of acceptable risk used for regulatory decision-making under CAA Section 112. Commercial sterilizing and chemical manufacturing facilities that use EtO self-reported emissions that were used to identify areas where there is increased risk.
USEPA gathered information nationwide from 2018–2019 on the facilities using EtO and began to evaluate potential rule revisions. In 2021, USEPA expanded the TRI reporting requirements for EtO to include contract sterilization facilities and MEG releases (USEPA 2022f).
3.3 Why are EtO Regulations Important?
Under the CAA, USEPA is required to promulgate National Emission Standards for Hazardous Air Pollutants (NESHAP), which includes categories of stationary sources of emissions of the 188 listed HAPs in Section 112(b) of the CAA. Under Section 112(c) of the CAA, a substance may be added to the list of HAPs if it is an air pollutant that is “known or suspected to cause cancer or other serious health effects, such as reproductive effects or birth defects, or adverse environmental effects” (USEPA 2023w). For more detailed information, visit the USEPA NESHAP page (USEPA 2023u).
Sources subject to NESHAPs are typically “required to perform an initial performance test to demonstrate compliance. To demonstrate continuous compliance, sources are generally required to monitor control device operating parameters, which are established during the initial performance test. Sources may also be required to install and operate continuous emission monitors or perform periodic emissions testing to demonstrate compliance. Consistent with USEPA’s Clean Air Act Stationary Source Compliance Monitoring Strategy, NESHAP sources that meet the Clean Air Act definition of ‘major source’ generally receive a full compliance evaluation by the state or regional office at least once every two years” (USEPA 2023w).
National regulations are important because (1) the regulations are developed from information gathered across the country; (2) the regulations create clear, consistent requirements for the regulated industry, creating a level playing field for facilities and regulators; (3) USEPA has resources to study the issues that may not be available at the state level; and (4) the broader benefits of regulating a facility can be weighed against the potential risk from the facility operations.
3.4 Regulations
3.4.1 Chemical Sterilization/Fumigation
The FDA states that, “Use of ethylene oxide is a well-established and scientifically-proven method of preventing harmful microorganisms from reproducing and causing infections without degrading the product, unlike some other sterilization methods.” Further, “more than 20 billion devices sold in the U.S. every year are sterilized with ethylene oxide, accounting for approximately 50% of devices that require sterilization. These devices range from wound dressings to more specialized devices, such as stents, as well as kits used in routine hospital procedures or surgeries that include multiple components made from different materials. Inadequate sterilization can lead to life-threatening infections in patients undergoing a wide range of medical procedures” (FDA 2022).
For more information on the FDA and EtO, visit: Sterilization for Medical Devices (FDA 2023b)
The NESHAP for Ethylene Oxide Emissions Standards for Commercial Sterilization and Fumigation Operations found in 40 Code of Federal Regulations (CFR) Part 63, Subpart O establishes emission standards for major and area sources that use at least 1 ton of EtO in sterilization or fumigation operations in any 12-month period (59 FR 6289 1994). The standards require existing and new major sources to control emissions to the level achievable by the maximum achievable control technology (MACT). The regulation also requires existing and new area sources to control emissions using generally available control technology. A proposed revision was released on April 11, 2023. Additional Resources on the proposed rule can be found on USEPA’s website (USEPA 2023z).
In 2022, USEPA released new information related to the impacts of certain EtO sterilization facilities on surrounding communities (USEPA 2023m). A national public webinar was held on August 10, 2022, a recording of which can be found here (USEPA 2022h). The new information website also includes the locations and names of commercial sterilizers where the estimated excess lifetime cancer risk associated with exposures from EtO emissions is at or above 100 in 1 million for people living nearby (USEPA 2023m). USEPA stated that they plan to engage with each of the communities located in the elevated risk areas by hosting public meetings for each location. During the second half of 2022, these community engagement efforts were conducted by USEPA.
As of December 2021, USEPA announced that they have broadened reporting on EtO. This change included extending the reporting requirements to 29 contract sterilization facilities that are now subject to the Toxics Release Inventory (TRI) (USEPA 2022f).
Those interested in information about EtO outreach can sign up on the USEPA EtO information page to receive the most up-to-date information (USEPA 2023m).
3.4.2 Miscellaneous Organic Chemical Manufacturing NESHAP
The Miscellaneous Organic NESHAP (MON) found in 40 CFR Part 63 Subpart FFFF establishes emission limits and work practice standards for “new and existing miscellaneous organic chemical manufacturing process units, wastewater treatment and conveyance systems, transfer operations, and associated ancillary equipment” (USEPA 2023t). Section 112(d) of the CAA requires all major sources to meet HAP emission standards and apply the MACT.
3.4.3 Synthetic Organic Chemical Manufacturing Industry / Hazardous Organic NESHAP
The Synthetic Organic Chemical Manufacturing Industry NESHAP (SOCMI), commonly known as the Hazardous Organic NESHAP (HON), found in 40 CFR Part 63 consists of four subparts (Subparts F, G, H, and I). Subpart F provides the applicability criteria for the HON and requires that “owners and operators of HON sources comply with subparts G and H, and specifies general recordkeeping and reporting requirements (USEPA 2023t). The specific control, monitoring, reporting, and recordkeeping requirements are stated in subpart G for process vents, storage vessels, transfer racks, and wastewater streams, and in subpart H for equipment leaks. Subpart I provides the applicability criteria for the non-HON processes subject to the negotiated regulation for equipment leaks and requires owners and operators to comply with subpart H” (USEPA 2023ae). On April 25, 2023, USEPA released a proposed rule and held a public webinar on the proposed updates to the standards. Additional resources related to the proposed rule can be found at the HON link above.
3.4.4 Hospital Sterilizers NESHAP
The NESHAP found in 40 CFR Part 63, Subpart WWWWW apply to any existing or new hospital EtO sterilization facility that is an area source of HAP. The owner or operator of an existing area source was required to comply with this area source NESHAP by December 29, 2008. The owner or operator of a new area source must comply with this area source NESHAP upon initial startup.
3.4.5 Polyether Polyols Production NESHAP
The NESHAP found in 40 CFR Part 63 Subpart PPP apply to any existing or new polyether polyol production facilities that use an epoxide compound and emit EtO. The final NESHAP rule establishes emission limits and control efficiency requirements for the following aspects of the manufacturing process: storage tanks, process vents, equipment leaks, and wastewater treatment systems.
3.4.6 Area Sources
USEPA is considering taking action based on the recommendations in the 2020 report issued by the Office of Inspector General (USEPA 2021e).
3.4.7 Federal Insecticide, Fungicide, and Rodenticide Act (FIFRA)
Tolerances for EtO and ECH are established under 40 CFR 180.151. This regulation is under revision and on March 28, 2023, USEPA released the Proposed Interim Registration Review Decision for EtO as it relates to pesticide use (USEPA 2023aa).
Under the Federal Insecticide, Fungicide, and Rodenticide Act (FIFRA), USEPA regulates the use of EtO as a sterilant (EtO is considered an antimicrobial and conventional pesticide). USEPA evaluates a wide variety of potential human health and environmental effects associated with the use of a pesticide through the registration review process(USEPA 2023aa). USEPA conducts this process, for all currently registered pesticides at least every 15 years to ensure that products can carry out their intended function without creating unreasonable risks to human health and the environment (USEPA 2022l). The EtO registration is currently undergoing review. As part of the FIFRA registration review for EtO, USEPA is continuing to assess potential human health risks, including those that come from working in facilities that use EtO or from living in communities near facilities that use EtO (USEPA 2020b).
In April 2023, USEPA released both a proposed interim decision for EtO and a draft risk assessment addendum that provides additional information on cancer risks from EtO (USEPA 2023aa).
USEPA’s Office of Pesticide Programs, which implements FIFRA, notes that MEG and ethylene chlorohydrin (ECH) form as hydrolysis reaction byproducts of EtO fumigation (see Figure 2). ECH is formed in EtO-fumigated commodities whenever a chloride ion is present (USEPA 2020c).
3.4.8 Federal Initiatives
3.4.8.1 United States Food and Drug Administration (FDA)
All sterilization operations of medical devices in the United States must use a validated sterilization process that meets internationally agreed upon voluntary consensus standards recognized by the FDA Center for Devices and Radiological Health (CDRH) (FDA 2023a). Sterilized medical devices must not exceed EtO or ECH levels as described in ISO Standard 10993:7. “The FDA is actively working with sterilization experts, medical device manufacturers, and other government agencies to advance innovative ways to sterilize medical devices with lower levels of currently used agents, and employ new agents or alternatives, while maintaining device safety and effectiveness” (FDA 2023b). Advances may include using lower levels of sterilization agents and employing new agents or alternatives, all while maintaining device safety and effectiveness.
The goal of the FDA CDRH Sterilization Master File Pilot Programs is to help “ensure patients have access to safe medical devices and encourage new, innovative ways to sterilize medical devices that reduce the potential impact of EtO on the environment and on public health” (FDA 2023b). In 2019, the FDA CDRH announced two public innovation challenges (FDA 2023b)to encourage the development of new sterilization methods to reduce EtO emissions:
- Challenge 1: Identify New Sterilization Methods and Technologies (FDA 2019a)
The goal of this challenge is to encourage the development of new approaches to device sterilization methods or technologies for medical devices that do not rely on EtO (FDA 2023b).
- Challenge 2: Reduce Ethylene Oxide Emissions (FDA 2019b)
The goal of this challenge is to develop strategies or technologies to reduce emissions from the EtO sterilization process to as close to zero as possible (FDA 2023b).
3.4.8.2 USEPA
Annually, the USEPA issues solicitations for Phase 1 and Phase II research proposals from science and technology firms. Phase II contracts are limited to small businesses that have successfully completed their Phase I projects. This Small Business Innovation Research Program aims to fund research into topics of broad interest to the scientific community to develop and commercialize innovative technologies (USEPA 2023ad). In 2021 and 2022 the solicitation included calls for novel EtO measurement technologies. Companies were awarded Phase I and Phase II grants to develop instrumentation (some of which are discussed in Section 6) to measure EtO over a wide range of concentrations from ambient environments to in-stack, source environments. A list of awardees is posted on the USEPA SBIR website (USEPA 2023p).
3.4.9 OSHA’s EtO Resources
The Occupational Safety and Health Administration (OSHA) was created to “ensure safe and healthful working conditions for workers by setting and enforcing standards and by providing training, outreach, education, and assistance” (OSHA 2023a). Follow the links below for EtO-related workplace information:
- Ethylene Oxide Overview (OSHA 2023c)
- Occupational Safety and Health Administration EtO Fact sheet (OSHA 2002)
- ASTM International Method D5578-04(2015) – Method by which OSHA determines EtO in workplace atmospheres (ASTM 2016)
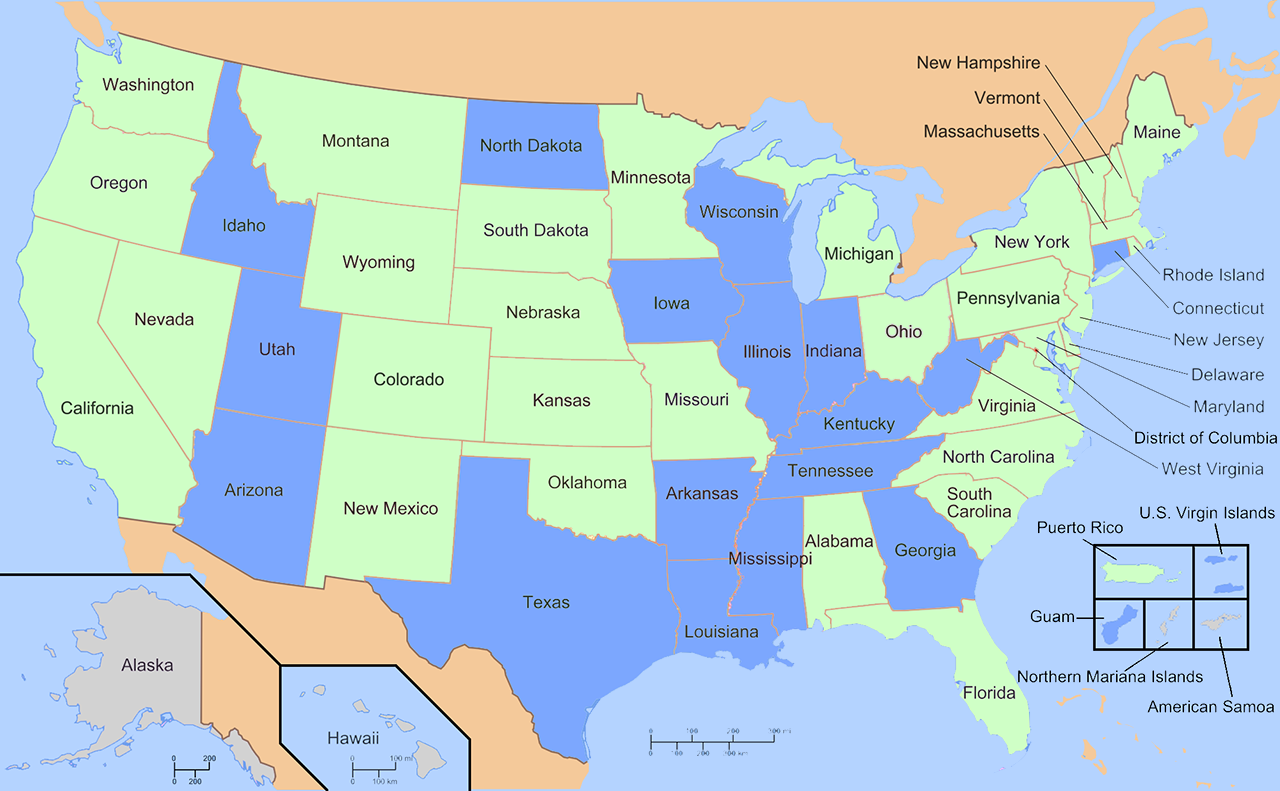
3.5 How are Individual States Addressing EtO?
State regulatory agencies often have the delegated authority to regulate and enforce environmental and public health requirements. The 50 states have different priorities, resources, and processes. Several states have been actively involved with addressing EtO emissions across multiple regulatory programs. Click on the map for detailed state information, including fact sheets, state delegation, USEPA information, and county-specific information (Figure 4).
Alabama
State Delegation on EtO
Alabama Department of Environmental Management, Air Program
USEPA Information
Part 63 National Emission Standards for Hazardous Air Pollutants (NESHAP) (2021)
County-Specific Information
City of Huntsville Department of Natural Resources
Alaska
Arizona
State Delegation on EtO
AZDEQ NESHAPs and NSPS
USEPA Information
Ethylene Oxide Commercial Sterilization Facilities | US EPA
CAA Permitting in EPA's Pacific Southwest (Region 9) | US EPA
County-Specific Information
Maricopa County
Arkansas
California
State Delegation on EtO
FINAL REGULATION ORDER , ETHYLENE OXIDE AIRBORNE TOXIC CONTROL MEASURE
Ethylene Oxide Airborne Toxic Control Measure (ATCM)
CA: South Coast Air Quality Management District - Proposed Amended Rule 1405 (aqmd.gov)
USEPA Information
US EPA Regulations for Ethylene Oxide
Ethylene Oxide Commercial Sterilization Facilities | US EPA
CAA Permitting in EPA's Pacific Southwest (Region 9) | US EPA
Fact Sheets
Ethylene Oxide (EtO) Fact Sheet (2008)
Colorado
State Delegation on EtO
Ethylene oxide and Terumo BCT | Department of Public Health & Environment (colorado.gov)
USEPA Information
Air Toxics Screening Assessment
Lakewood, Colorado (Terumo BCT Sterilization Service, Inc.)
Ethylene Oxide Commercial Sterilization Facilities | US EPA
County-Specific Information
Community risk assessment of ethylene oxide near
Connecticut
Delaware
Florida
State Delegation on EtO
62-210.310 : Air General Permits - Florida Administrative Rules, Law, Code, Register - FAC, FAR, Rulemaking (flrules.org)
USEPA Information
Ethylene Oxide Emissions Standards for Sterilization Facilities: National Emission Standards for Hazardous Air Pollutants (NESHAP) | US EPA
Groveland, Florida (International Sterilization Laboratory)
Ethylene Oxide Commercial Sterilization Facilities | US EPA
Frequent Questions about Ethylene Oxide (EtO) | US EPA
County-Specific Information
Groveland, FL
https://www.epa.gov/fl/temple-terrace-fl-american-contract-systems
Fort Myers, FL (American Contract Systems (Fort Myers Facility)) | US EPA
Georgia
State Delegation on EtO
AIR PROTECTION BRANCH 2020 Air Quality Report
USEPA Information
Subject 391-3-1 AIR QUALITY CONTROL, Rule 391-3-1-.01 Definitions. Amended
Georgia EPD Comments on 2017 AirToxScreen
Ethylene Oxide Commercial Sterilization Facilities | US EPA
County-Specific Information
Ethylene oxide: Technical Reviews and Outreach to Potentially Affected Communities Status Report -- Sterigenics Cobb County, Smyrna, Georgia
Hawaii
State Delegation on EtO
Clean Air Branch (hawaii.gov)
USEPA Information
CAA Permitting in EPA's Pacific Southwest (Region 9) | US EPA
Idaho
State Delegation on EtO
IDAPA 58 - Department of Environmental Quality. Book (idaho.gov)
Illinois
State Delegation on EtO
Public Act 101-0022, Illinois General Assembly
Public Act 101-0023, Illinois General Assembly (2019)
USEPA Information
Ethylene Oxide Commercial Sterilization Facilities | US EPA
Indiana
Iowa
State Delegation on EtO
CHAPTER 22 CONTROLLING POLLUTION
USEPA Information
Air Toxics: EPA Updates Several Regulations
Air Toxics Update: Miscellaneous Organic Chemical Manufacturing (MON) (2020)
Ethylene Oxide Commercial Sterilization Facilities | US EPA
County-Specific Information
Air Quality - Polk County Iowa
Outdoor Air Quality | Linn County, IA - Official Website (linncountyiowa.gov)
Air Toxics | Linn County, IA - Official Website (linncountyiowa.gov)
Kansas
State Delegation on EtO
KS-Air-Quality-Regulations-PDF
USEPA Information
Delegation of Authority in Kansas for New Source Performance Standards and National Emission Standards for Hazardous Air Pollutants | US EPA
County-Specific Information
https://www.wycokck.org/Departments/Health/Clean-Safe-Places/Air-Quality
Kentucky
State Delegation on EtO
Title 401 Chapter 59 Regulation 090 • Kentucky Administrative Regulations • Legislative Research Commission
USEPA Information
Title 401 Chapter 57 Regulation 002 • Kentucky Administrative Regulations • Legislative Research Commission
County-Specific Information
Regulation 5.14 Version 8 Hazardous Air Pollutants and Source Categories Louisville Metro Air Pollution Control District 2012 (louisvilleky.gov)
Louisiana
State Delegation on EtO
TITLE 33 Part III. Air (2013)
USEPA Information
Air Issues in Louisiana | US EPA
Maine
State Delegation on EtO
https://www.maine.gov/dep/air/monitoring/index.html
Ethylene Oxide Commercial Sterilization Facilities | US EPA
County-Specific Information
Findings of Fact Amendment #1. Jackson Laboratory, Hancock County, Maine. State of Main DEP
Findings of Fact Amendment #5. Jackson Laboratory, Hancock County, Maine. State of Main DEP
Maryland
State Delegation on EtO
Toxic Air Pollutant Regulations Assistance (maryland.gov)
2012-Revised-TAP-Screening-Levels-cas-sort.pdf (maryland.gov)
USEPA Information
Ethylene Oxide Commercial Sterilization Facilities | US EPA
Fact Sheets
Title 5 Fact Sheet (maryland.gov)
County-Specific Information
Hanover, MD
Massachusetts
State Delegation on EtO
Massachusetts Department of Environmental Protection (MassDEP) Top Case BACT Guidelines For MECHANICAL AND MISCELLANEOUS SOURCES
USEPA Information
Ethylene Oxide Commercial Sterilization Facilities | US EPA
Fact Sheets
Massachusetts Toxics Use Reduction Institute, Ethylene Oxide Fact Sheet
County-Specific Information
Taunton, MA
Michigan
State Delegation on EtO
Fact Sheets
Ethylene Oxide Air Emissions Viant Medical Inc. Frequently Asked Questions (2019)
Minnesota
State Delegation on EtO
Minnesota Rules 2020, Chapter 7007 (mn.gov)
USEPA Information
Minnesota Administrative Rules 7011.7140 INCORPORATION BY REFERENCE; EMISSION STANDARDS; ETHYLENE OXIDE FOR STERILIZERS.
Ethylene Oxide Commercial Sterilization Facilities | US EPA
Fact Sheets
Facts about Air Quality Permit Rules (2010)
Mississippi
Missouri
State Delegation on EtO
Area Sources and Standards | Missouri Department of Natural Resources (mo.gov)
Missouri Secretary of State: Code of State Regulations (mo.gov)
USEPA Information
Ethylene Oxide Commercial Sterilization Facilities | US EPA
County-Specific Information
Jackson, MO
Montana
State Delegation on EtO
Administrative Rules of the State of Montana (mt.gov)
Nebraska
State Delegation on EtO
AIR QUALITY REGULATIONS STATE OF NEBRASKA DEPARTMENT OF ENVIRONMENTAL QUALITY - TITLE129 6-15-11.DOC (ne.gov)
USEPA Information
Ethylene Oxide Commercial Sterilization Facilities | US EPA
County-Specific Information
Columbus, NE
Nevada
State Delegation on EtO
NAC: CHAPTER 445B - AIR CONTROLS (state.nv.us)
USEPA Information
Lincoln-Lancaster County Health Department Air Quality Program 40 CFR Part 63 Subpart WWWWW – Initial Notification / Notification of Compliance Status
Ethylene Oxide Commercial Sterilization Facilities | US EPA
CAA Permitting in EPA's Pacific Southwest (Region 9) | US EPA
New Hampshire
State Delegation on EtO
https://www.des.nh.gov/air/industrial-sources/air-toxics-compliance
New Jersey
State Delegation on EtO
NJ EtO reporting guidelines
https://dep.nj.gov/airquality/
USEPA Information
Ethylene Oxide Commercial Sterilization Facilities | US EPA
Fact Sheets
FACT SHEET Ethylene Oxide (EtO) Air Emissions from Commercial Sterilizers (2022)
Hazardous Substance Fact Sheet, Ethylene Oxide (revised 2016)
County-Specific Information
Franklin , NJ
New Mexico
State Delegation on EtO
83-FR-15964-EPA-Delegation-to-NM.pdf
USEPA Information
Ethylene Oxide Commercial Sterilization Facilities | US EPA
New York
North Carolina
State Delegation on EtO
SECTION .0500 - EMISSION CONTROL STANDARDS (pg. 53)
USEPA Information
Ethylene Oxide Commercial Sterilization Facilities | US EPA
County-Specific Information
FORSYTH COUNTY, NORTH CAROLINA
Appendices to the Forsyth County, NC, Air Quality Control Code and Air Quality Technical Code (2000)
North Dakota
Ohio
Oklahoma
State Delegation on EtO
Federal Register / Vol. 87, No. 139 / Thursday, July 21, 2022 / Rules and Regulation
Revisions to SIP for State of Oklahoma (epa.gov)
USEPA Information
Ethylene Oxide Commercial Sterilization Facilities | US EPA
County-Specific Information
Ardmore, OK
Oregon
Pennsylvania
State Delegation on EtO
Emission Standards (pa.gov)
USEPA Information
PADEP Comments to EPA EtO ANRPM.pdf (state.pa.us)
Technical Air Pollution Resources | US EPA
Ethylene Oxide Commercial Sterilization Facilities | US EPA
County-Specific Information
Erie, PA
Rhode Island
State Delegation on EtO
RI DEM/Air Resources- Air Pollution Control Regulation No. 22- Air Toxics
USEPA Information
Ethylene Oxide Commercial Sterilization Facilities | US EPA
South Carolina
South Dakota
Tennessee
Texas
USEPA Information
40 CFR Part 63 - National Emission Standards for Hazardous Air Pollutants for Source Categories (a.k.a. Maximum Achievable Control Technology (MACT))
40 CFR Part 63 Subpart WWWWW -- National Emission Standards for Hospital Ethylene Oxide Sterilizers
Ethylene Oxide Commercial Sterilization Facilities | US EPA
County-Specific Information
Athens, TX
Utah
USEPA Information
Ethylene Oxide in Utah - Utah Department of Environmental Quality
Ethylene Oxide Commercial Sterilization Facilities | US EPA
County-Specific Information
Sandy, UT
Vermont
State Delegation on EtO
STATE OF VERMONT AGENCY OF NATURAL RESOURCES, AIR POLLUTION CONTROL REGULATIONS (2018)
County-Specific Information
1382.doc (live.com)
Virginia
State Delegation on EtO
Department of Veterans Affairs Veterans Health Administration, Safe use of Ethylene Oxide (2017)
Virginia Register of Regulations Vol. 2 Iss. 11
USEPA Information
Ethylene Oxide Commercial Sterilization Facilities | US EPA
County-Specific Information
Henrico, VA
Washington
State Delegation on EtO
Chapter 173-401 WAC: Thresholds for hazardous air pollutants.
County-Specific Information
Benton Clean Air Agency
SWCAA Permits (swcleanair.gov)Permits & Registration | Puget Sound Clean Air Agency, WA (pscleanair.gov)
Permits and Services | Northwest Clean Air Agency (nwcleanairwa.gov)
Air Operating Permits - Spokane Regional Clean Air Agency (spokanecleanair.org)
Yakima County Air Quality - Yakima Regional Clean Air Agency (yakimacleanair.org)
West Virginia
Wisconsin
Wyoming
State Delegation on EtO
Environmental Quality, Dept. of Air Quality, Chapter 5: National Emission Standards
American Samoa
Commonwealth of the Northern Mariana Islands
Guam
Puerto Rico
State Delegation on EtO
Amendments-7985-for-the-Regulation-for-the-Control-of-Atmospheric-Air-Pollution-Reg-5300.pdf (pr.gov)
Regulations-for-the-Control-of-Atmospheric-Pollution-RCAP-1995-Regulation-No-5300.pdf (pr.gov)
USEPA Information
Ethylene Oxide Commercial Sterilization Facilities | US EPA
County-Specific Information
Añasco, PR
US Virgin Islands
Delegation Key:
– no delegation
– delegation
– delegation + extra info/state info/USEPA info
Figure 4. Interactive EtO Regulations, Resources, and Processes tool.
Figure 4 PDF File

4. Sources of EtO
4.1 Introduction
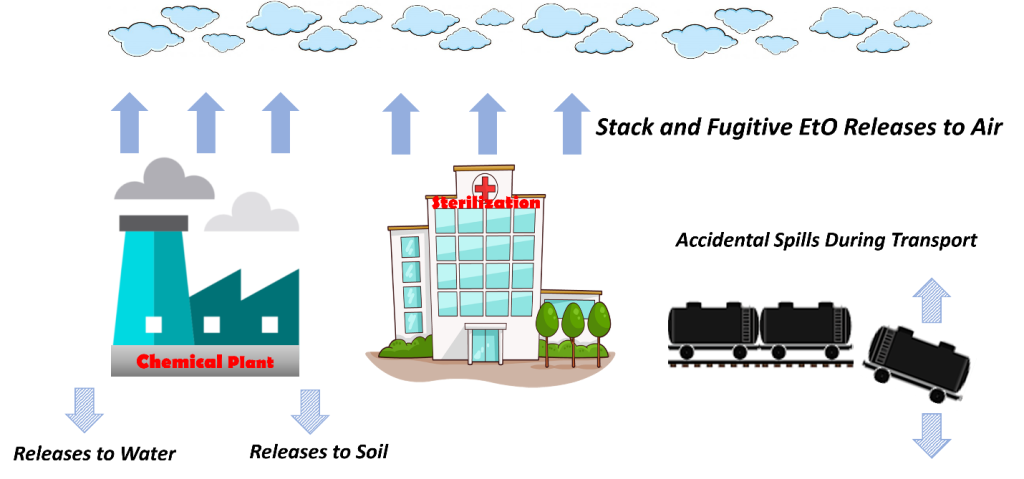
EtO is best known for its uses in chemical manufacturing and sterilization. There are several known and potential sources of EtO and different ways it can be released into the environment, such as from industrial or sterilization facilities (Figure 5). Releases of EtO to air are a primary concern due to the health risks associated with inhalation exposure. This section describes available data on releases of EtO to the environment, known sources of EtO emissions to air, and potential sources of EtO emissions to air.
4.2 Data on Releases of EtO to the Environment
EtO releases to the environment are recorded under the USEPA TRI Program (USEPA 2023ag). The TRI Program encompasses several hundred toxic chemicals that may pose a threat to human health and the environment and supports informed decision-making by communities, governments, and industry. Specifically, TRI reflects annual reporting requirements for EtO use and stack and fugitive releases (Scientific Control Laboratories 2019). Users and stationary manufacturing facilities are required to report this information as well as all occasional accidental spills greater than 10 pounds (PHMSA 1998, USEPA 2022d) that occur as a result of transport or packaging activities (see Figure 5) (49 CFR 171.15 2003). In December 2021, USEPA extended TRI reporting requirements for EtO releases to include certain contract sterilization facilities that had previously not been required to report (USEPA 2021d). More information about incident reporting can be found at this link (USDOT 2019).
The Air Toxics Screening Assessment (AirToxScreen) (USEPA 2023h) is USEPA’s screening tool to provide communities with information about health risks from air toxics, which is based on the IRIS value (see Section 2.4 for more information). At the time of this writing, the most current version of AirToxScreen uses 2019 data. The 2019 AirToxScreen includes HAP emissions from the 2017 National Emissions Inventory (NEI) and USEPA emissions estimates of EtO from commercial sterilizers. The NEI consists of estimated emissions of criteria pollutants, criteria precursors, and HAP that USEPA collects from state, local, and tribal air agencies. USEPA augments this data set with other data sources, including the TRI. At the time of this writing, the 2020 NEI has the most current set of EtO emissions data, which will be incorporated into the 2020 AirToxScreen.
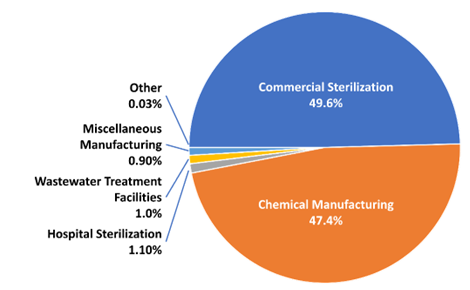
Other than the sterilizer data, almost all EtO data in the NEI are from facility-total stack and facility-total fugitive emissions that have been reported to state, local, and tribal agencies who then report to USEPA. Additional data about EtO emissions comes from the TRI (USEPA 2022b). AirToxScreen also includes 0.97 tons of EtO from nonpoint wastewater treatment (using the same 2017 NEI estimate because nonpoint activity and emissions are surveyed every three years). The 2019 commercial sterilizer emissions estimates are based on industry responses to USEPA’s information collection requests of December 2019 and September 2021 associated with a risk and technology review (RTR) proposal to amend the NESHAP for commercial sterilizers. The same methodology was used to estimate emissions for modeling risk in this rulemaking. Commercial sterilizer EtO emissions estimates in 2017 and 2018 AirToxScreen were prepared like those for 2019 AirToxScreen but were based on the activity and emissions controls operating for each calendar year. Figure 6 includes TRI, NEI, and RTR data, which are the most up-to-date publicly available information on these sources (USEPA 2021b). The percent contribution of emissions by industries varies from year to year.
AirToxScreen emissions point source spreadsheet contains point source emissions, including EtO emissions, by facility, with facility IDs, county, state, and facility coordinates (USEPA 2021b).
Facility emissions were reported to USEPA by state and local agencies. For facilities where EtO emissions were not reported in the emissions inventory process, USEPA obtained the data from the 2019 TRI. For facilities where EtO emissions were not available in the 2019 TRI, USEPA obtained the data from the 2017 NEI. In addition, USEPA amended these data by using more current information about 2019 emissions from the Commercial Sterilizers RTR analysis. Emissions were categorized by industry type based on the North American Industry Classification System (NAICS) code reported for each facility or source classification code reported for each process. While the 2019 AirToxScreen data set is the most recent available, it may not account for EtO emissions from all facilities that emit EtO because some of these facilities are not subject to federal, state, local, or TRI emission reporting requirements. TRI reporting requirements can be found here (USEPA 2023ah).
4.3 Known Sources of EtO
4.3.1 Sterilization Sources
The FDA states that “use of ethylene oxide is a well-established and scientifically-proven method of preventing harmful microorganisms from reproducing and causing infections without degrading the product, unlike some other sterilization methods” (FDA 2022). Further, “more than 20 billion devices sold in the U.S. every year are sterilized with ethylene oxide, accounting for approximately 50% of devices that require sterilization. These devices range from wound dressings to more specialized devices, such as stents, as well as kits used in routine hospital procedures or surgeries that include multiple components made from different materials. Inadequate sterilization can lead to life-threatening infections in patients undergoing a wide range of medical procedures” (FDA 2022).
Sterilization with EtO is used for medical devices and equipment, laboratory equipment, dried herbs and spices, and pest control of imported goods when the objects being sterilized cannot withstand high temperature treatment moisture or otherwise destructive characteristics of available sterilization alternatives (i.e., irradiation, steam, etc.). This process requires a chamber to control variables such as temperature, time, concentration, and pressure.
4.3.1.1 Commercial Sterilization
Commercial sterilization can be broken into two categories: large scale and small scale. The differentiating factors between the categories are the size of EtO containers used and permitting requirements. Small-scale sterilization uses either cartridges or bottles to deploy EtO into the chamber, whereas large-scale sterilization uses either cylinders or drums of EtO.
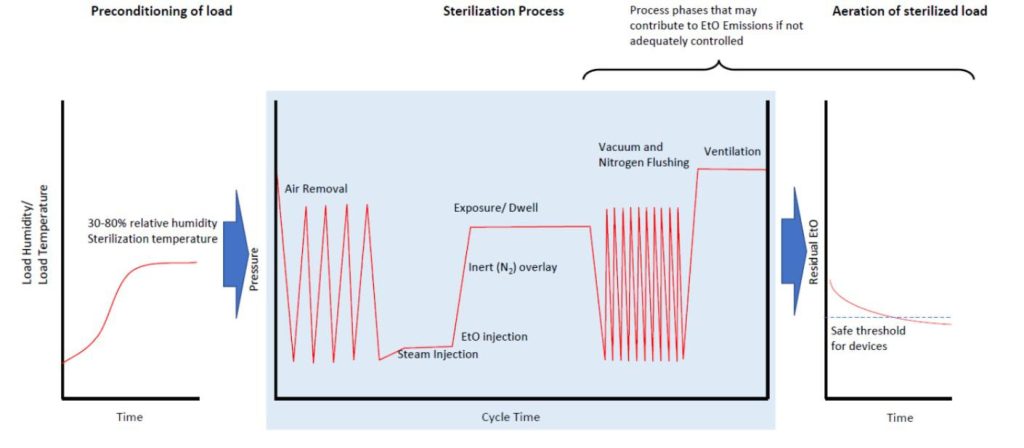
Typical commercial sterilization follows the same process: preconditioning, sterilization, and aeration (Figure 7). A more detailed description of the sterilization process can be found at this FDA webpage (FDA 2019c).
4.3.1.2 Medical Equipment Sterilization
Many medical care facilities have all-in-one sterilization chambers (i.e., sterilization and aeration occur in one chamber) that may be similar to commercial sterilizer chambers. These types of facilities only sterilize equipment that will be used within the medical facility and generally work on a smaller scale than a commercial sterilization operation (e.g., benchtop sterilization unit).
4.3.1.3 Fumigation/Spice/Pest
Bulk dried herbs and spices are sterilized in chambers using processes similar to those used in commercial sterilizers (USEPA 2023ab).
4.3.1.4 Noncommercial Benchtop Sterilization
Several manufacturers sell benchtop EtO sterilizers that can be used at smaller facilities such as surgical centers, dental offices, veterinary clinics, tattoo parlors, and nail salons. As of the publication of this guide, sterilization using EtO in these settings is not well documented; however, it is not expressly prohibited under FIFRA. Follow this link for a video on the benchtop sterilization process (DLEAH 2020).
4.3.2 Chemical Manufacturing Sources
The chemical manufacturing sector converts EtO from raw material into many commercial and industrial products (see Section 2.2). Stack and fugitive emissions may be produced before and during conversion of EtO into other products. Stack emissions can be effectively controlled with a variety of control technologies (for more information, see Section 5). Fugitive emissions are typically managed by leak detection and repair.
4.3.3 Fugitive Emissions
Defined in 40 CFR 63.2, fugitive emissions are “those emissions that could not reasonably pass through a stack, chimney, vent, or functionally equivalent opening.” As stated in the American Chemistry Council (ACC) EtO product stewardship guidance manual, “fugitive emissions include equipment leaks, evaporative losses from surface impoundments, spills, and releases from building ventilation systems. EtO fugitive emissions may be calculated rather than measured” (ACC 2023b, 33). Examples of this could include mass balance or calculations based on gas laws. The ACC also states that “In some instances, measurements are used to validate calculations. In some cases, fugitive emissions can be a large contributor to reported emissions” (ACC 2023b, 33).
As discussed in Section 3, state and federal regulations limit EtO emissions. The MON, for example, sets “emission limits and work practice standards for new and existing miscellaneous organic chemical manufacturing process units, wastewater treatment and conveyance systems, transfer operations, and associated ancillary equipment” (USEPA 2023t). For the chemical manufacturing sector, federal regulations for leak detection and repair cover the frequency and protocol for monitoring valves, connectors, pump seals, compressors, and other fugitive emission sources and require corrective actions, as appropriate (see Section 3.4 of this guide for more information). On April 25, 2023, USEPA proposed a standard for fugitive emissions from commercial sterilization and fumigation operations; however, those regulations are under development. Efforts to evaluate emissions from products post-sterilization outside of sterilization facilities (e.g., in warehouses or storage locations) are ongoing, and additional work is needed.
Residual emissions and off-gassing of EtO from treated medical devices and dried herbs and spices are not expected to be a concern for consumers (USEPA 2022g). Refer to USEPA’s Ethylene Oxide National Public Webinar for more information (USEPA 2022h).
4.4 Potential Sources
The potential contributions of EtO to the atmosphere by nonindustrial sources has received little study and is an emerging area of science. Several types of potential EtO sources have been mentioned in this guide (Figure 8), and these sources of EtO are expected to vary over time as relevant economic and environmental conditions change and technical knowledge is accumulated. This guide attempts to cover these potential sources and provide examples of the EtO science that is better understood. This information is subject to change in the future.
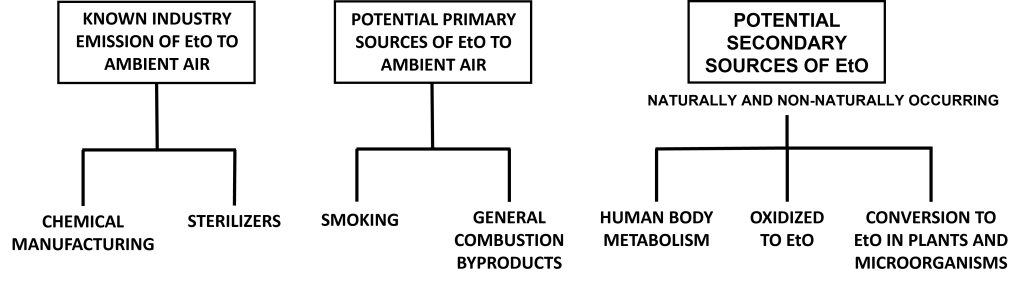
Figure 8 does not represent the magnitude of source contributions. Image is not to scale and does not represent equivalence in contributions. These sources are documented in Section 4 and appendix. Please click the text in the figure for more information on these sources.
EtO can be created via several chemical and biological mechanisms identified in microbes, plants, and animals (for more information, see appendix). Not all of the chemical mechanisms are well studied or understood because these reactions can be either primary or secondary sources of EtO. For the purposes of this guide, secondary sources are those that require metabolism or a chemical reaction to produce EtO.
In simplest terms EtO is an oxidation product of ethylene (C2H4) or ethane (C2H6). Ethylene is a precursor to the formation of EtO, as well as other chemicals that are not discussed in this guide. Ethylene is a reactive chemical intermediate and an important naturally occurring plant hormone and is also a known byproduct of combustion. Ethylene can be converted to EtO through chemical and biological processes. The extent to which the conversion of ethylene to EtO occurs is currently not fully understood.
More research is necessary to better understand the pathways. They could be a direct conversion or part of a more complex reaction that potentially involves other VOCs or particles and photochemical reactions in the air.
Endogenous creation of EtO can occur in microbes, plants, and animals. In plants, enzymatic oxidation of ethylene, a phytohormone in plants, is the first step to create EtO, glucose derivatives, or MEG and CO2 (see appendix and Beyer (1984)).
Work is currently being done to identify nonindustrial contributions of EtO in forested rural locations. For example, South Carolina (SCDHEC 2019) and Georgia (GAEPD 2019) have both been working with federal funds to learn more about the presence of EtO in these areas.
4.4.1 Combustion Byproduct
Some evidence suggests that EtO can be emitted as a combustion byproduct (Kirman et al. 2021) (Figure 9). Because of concerns about potential toxicity from EtO formed through combustion, additional research is needed to determine whether EtO is a byproduct of combustion. If it is, further investigation is necessary to determine the potential emission rates from different types of combustion processes and fuel combinations.
This work can better inform the potential risk to those with the highest exposure to combustion emissions. Descriptions of several combustion sources and information about their potential EtO emissions are provided below.
4.4.1.1 Cigarette Smoke and Vaping
Cigarette smoke (Figure 10) contains more than 70 carcinogens, potentially including EtO (ATSDR 2022d, CDC 2019). Based on elevated levels of EtO hemoglobin adducts in blood samples from smokers compared to the general population, the Agency for Toxic Substances and Disease Registry (ATSDR) suggests that EtO is present in cigarette smoke (CDC 2022, Filser et al. 1992, Jain 2020). A recent literature review (Kirman et al. 2021) provides an overview of the characterization of potential total exposure to EtO via endogenous and exogenous pathways. Studies have also shown that e-cigarettes have been found to contain some of the same carcinogenic compounds as traditional cigarettes. In several studies, analysis of the short-term urinary mercapturic acid metabolite of EtO (HEMA) in e-cigarette users and traditional tobacco smokers reported elevated levels of this metabolite, compared to nonsmokers (Eckert et al. 2011, Frigerio et al. 2020, Jacob et al. 2013, Rubinstein et al. 2018).
4.4.1.2 Wildfires and Prescribed Burning
Emission of EtO is not a known component of smoke from wildfires or prescribed fires (USEPA 2021a, 7-11 to 7-13, Tables 7-8 and 7-9). If EtO is emitted as a byproduct of combustion, then it is possible that combustion of biomass, such as from wildfires, could be a potential source. More research is needed to determine whether this is the case.
4.4.1.3 Fuel Combustion in Mobile and Stationary Sources
A wide variety of fuels such as natural gas, fuel oils, gasoline, coal, and wood are combusted to power both on-road and nonroad motor vehicles, as well as to provide heat and electricity for buildings, homes, and industrial processes. Few published studies focus on EtO emissions from mobile and stationary combustion sources. USEPA currently notes that EtO emissions from mobile exhaust have not been confirmed, but they are working to develop test methods that will allow careful evaluation of this potential combustion source to determine the extent to which EtO may be emitted (USEPA 2023a)
4.1 Introduction
EtO is best known for its uses in chemical manufacturing and sterilization. There are several known and potential sources of EtO and different ways it can be released into the environment, such as from industrial or sterilization facilities (Figure 5). Releases of EtO to air are a primary concern due to the health risks associated with inhalation exposure. This section describes available data on releases of EtO to the environment, known sources of EtO emissions to air, and potential sources of EtO emissions to air.
4.2 Data on Releases of EtO to the Environment
EtO releases to the environment are recorded under the USEPA TRI Program (USEPA 2023ag). The TRI Program encompasses several hundred toxic chemicals that may pose a threat to human health and the environment and supports informed decision-making by communities, governments, and industry. Specifically, TRI reflects annual reporting requirements for EtO use and stack and fugitive releases (Scientific Control Laboratories 2019). Users and stationary manufacturing facilities are required to report this information as well as all occasional accidental spills greater than 10 pounds (PHMSA 1998, USEPA 2022d) that occur as a result of transport or packaging activities (see Figure 5) (49 CFR 171.15 2003). In December 2021, USEPA extended TRI reporting requirements for EtO releases to include certain contract sterilization facilities that had previously not been required to report (USEPA 2021d). More information about incident reporting can be found at this link (USDOT 2019).
The Air Toxics Screening Assessment (AirToxScreen) (USEPA 2023h) is USEPA’s screening tool to provide communities with information about health risks from air toxics, which is based on the IRIS value (see Section 2.4 for more information). At the time of this writing, the most current version of AirToxScreen uses 2019 data. The 2019 AirToxScreen includes HAP emissions from the 2017 National Emissions Inventory (NEI) and USEPA emissions estimates of EtO from commercial sterilizers. The NEI consists of estimated emissions of criteria pollutants, criteria precursors, and HAP that USEPA collects from state, local, and tribal air agencies. USEPA augments this data set with other data sources, including the TRI. At the time of this writing, the 2020 NEI has the most current set of EtO emissions data, which will be incorporated into the 2020 AirToxScreen.
Other than the sterilizer data, almost all EtO data in the NEI are from facility-total stack and facility-total fugitive emissions that have been reported to state, local, and tribal agencies who then report to USEPA. Additional data about EtO emissions comes from the TRI (USEPA 2022b). AirToxScreen also includes 0.97 tons of EtO from nonpoint wastewater treatment (using the same 2017 NEI estimate because nonpoint activity and emissions are surveyed every three years). The 2019 commercial sterilizer emissions estimates are based on industry responses to USEPA’s information collection requests of December 2019 and September 2021 associated with a risk and technology review (RTR) proposal to amend the NESHAP for commercial sterilizers. The same methodology was used to estimate emissions for modeling risk in this rulemaking. Commercial sterilizer EtO emissions estimates in 2017 and 2018 AirToxScreen were prepared like those for 2019 AirToxScreen but were based on the activity and emissions controls operating for each calendar year. Figure 6 includes TRI, NEI, and RTR data, which are the most up-to-date publicly available information on these sources (USEPA 2021b). The percent contribution of emissions by industries varies from year to year.
AirToxScreen emissions point source spreadsheet contains point source emissions, including EtO emissions, by facility, with facility IDs, county, state, and facility coordinates (USEPA 2021b).
Facility emissions were reported to USEPA by state and local agencies. For facilities where EtO emissions were not reported in the emissions inventory process, USEPA obtained the data from the 2019 TRI. For facilities where EtO emissions were not available in the 2019 TRI, USEPA obtained the data from the 2017 NEI. In addition, USEPA amended these data by using more current information about 2019 emissions from the Commercial Sterilizers RTR analysis. Emissions were categorized by industry type based on the North American Industry Classification System (NAICS) code reported for each facility or source classification code reported for each process. While the 2019 AirToxScreen data set is the most recent available, it may not account for EtO emissions from all facilities that emit EtO because some of these facilities are not subject to federal, state, local, or TRI emission reporting requirements. TRI reporting requirements can be found here (USEPA 2023ah).
4.3 Known Sources of EtO
4.3.1 Sterilization Sources
The FDA states that “use of ethylene oxide is a well-established and scientifically-proven method of preventing harmful microorganisms from reproducing and causing infections without degrading the product, unlike some other sterilization methods” (FDA 2022). Further, “more than 20 billion devices sold in the U.S. every year are sterilized with ethylene oxide, accounting for approximately 50% of devices that require sterilization. These devices range from wound dressings to more specialized devices, such as stents, as well as kits used in routine hospital procedures or surgeries that include multiple components made from different materials. Inadequate sterilization can lead to life-threatening infections in patients undergoing a wide range of medical procedures” (FDA 2022).
Sterilization with EtO is used for medical devices and equipment, laboratory equipment, dried herbs and spices, and pest control of imported goods when the objects being sterilized cannot withstand high temperature treatment moisture or otherwise destructive characteristics of available sterilization alternatives (i.e., irradiation, steam, etc.). This process requires a chamber to control variables such as temperature, time, concentration, and pressure.
4.3.1.1 Commercial Sterilization
Commercial sterilization can be broken into two categories: large scale and small scale. The differentiating factors between the categories are the size of EtO containers used and permitting requirements. Small-scale sterilization uses either cartridges or bottles to deploy EtO into the chamber, whereas large-scale sterilization uses either cylinders or drums of EtO.
Typical commercial sterilization follows the same process: preconditioning, sterilization, and aeration (Figure 7). A more detailed description of the sterilization process can be found at this FDA webpage (FDA 2019c).
4.3.1.2 Medical Equipment Sterilization
Many medical care facilities have all-in-one sterilization chambers (i.e., sterilization and aeration occur in one chamber) that may be similar to commercial sterilizer chambers. These types of facilities only sterilize equipment that will be used within the medical facility and generally work on a smaller scale than a commercial sterilization operation (e.g., benchtop sterilization unit).
4.3.1.3 Fumigation/Spice/Pest
Bulk dried herbs and spices are sterilized in chambers using processes similar to those used in commercial sterilizers (USEPA 2023ab).
4.3.1.4 Noncommercial Benchtop Sterilization
Several manufacturers sell benchtop EtO sterilizers that can be used at smaller facilities such as surgical centers, dental offices, veterinary clinics, tattoo parlors, and nail salons. As of the publication of this guide, sterilization using EtO in these settings is not well documented; however, it is not expressly prohibited under FIFRA. Follow this link for a video on the benchtop sterilization process (DLEAH 2020).
4.3.2 Chemical Manufacturing Sources
The chemical manufacturing sector converts EtO from raw material into many commercial and industrial products (see Section 2.2). Stack and fugitive emissions may be produced before and during conversion of EtO into other products. Stack emissions can be effectively controlled with a variety of control technologies (for more information, see Section 5). Fugitive emissions are typically managed by leak detection and repair.
4.3.3 Fugitive Emissions
Defined in 40 CFR 63.2, fugitive emissions are “those emissions that could not reasonably pass through a stack, chimney, vent, or functionally equivalent opening.” As stated in the American Chemistry Council (ACC) EtO product stewardship guidance manual, “fugitive emissions include equipment leaks, evaporative losses from surface impoundments, spills, and releases from building ventilation systems. EtO fugitive emissions may be calculated rather than measured” (ACC 2023b, 33). Examples of this could include mass balance or calculations based on gas laws. The ACC also states that “In some instances, measurements are used to validate calculations. In some cases, fugitive emissions can be a large contributor to reported emissions” (ACC 2023b, 33).
As discussed in Section 3, state and federal regulations limit EtO emissions. The MON, for example, sets “emission limits and work practice standards for new and existing miscellaneous organic chemical manufacturing process units, wastewater treatment and conveyance systems, transfer operations, and associated ancillary equipment” (USEPA 2023t). For the chemical manufacturing sector, federal regulations for leak detection and repair cover the frequency and protocol for monitoring valves, connectors, pump seals, compressors, and other fugitive emission sources and require corrective actions, as appropriate (see Section 3.4 of this guide for more information). On April 25, 2023, USEPA proposed a standard for fugitive emissions from commercial sterilization and fumigation operations; however, those regulations are under development. Efforts to evaluate emissions from products post-sterilization outside of sterilization facilities (e.g., in warehouses or storage locations) are ongoing, and additional work is needed.
Residual emissions and off-gassing of EtO from treated medical devices and dried herbs and spices are not expected to be a concern for consumers (USEPA 2022g). Refer to USEPA’s Ethylene Oxide National Public Webinar for more information (USEPA 2022h).
4.4 Potential Sources
The potential contributions of EtO to the atmosphere by nonindustrial sources has received little study and is an emerging area of science. Several types of potential EtO sources have been mentioned in this guide (Figure 8), and these sources of EtO are expected to vary over time as relevant economic and environmental conditions change and technical knowledge is accumulated. This guide attempts to cover these potential sources and provide examples of the EtO science that is better understood. This information is subject to change in the future.
Figure 8 does not represent the magnitude of source contributions. Image is not to scale and does not represent equivalence in contributions. These sources are documented in Section 4 and appendix. Please click the text in the figure for more information on these sources.
EtO can be created via several chemical and biological mechanisms identified in microbes, plants, and animals (for more information, see appendix). Not all of the chemical mechanisms are well studied or understood because these reactions can be either primary or secondary sources of EtO. For the purposes of this guide, secondary sources are those that require metabolism or a chemical reaction to produce EtO.
In simplest terms EtO is an oxidation product of ethylene (C2H4) or ethane (C2H6). Ethylene is a precursor to the formation of EtO, as well as other chemicals that are not discussed in this guide. Ethylene is a reactive chemical intermediate and an important naturally occurring plant hormone and is also a known byproduct of combustion. Ethylene can be converted to EtO through chemical and biological processes. The extent to which the conversion of ethylene to EtO occurs is currently not fully understood.
More research is necessary to better understand the pathways. They could be a direct conversion or part of a more complex reaction that potentially involves other VOCs or particles and photochemical reactions in the air.
Endogenous creation of EtO can occur in microbes, plants, and animals. In plants, enzymatic oxidation of ethylene, a phytohormone in plants, is the first step to create EtO, glucose derivatives, or MEG and CO2 (see appendix and Beyer (1984)).
Work is currently being done to identify nonindustrial contributions of EtO in forested rural locations. For example, South Carolina (SCDHEC 2019) and Georgia (GAEPD 2019) have both been working with federal funds to learn more about the presence of EtO in these areas.
4.4.1 Combustion Byproduct
Some evidence suggests that EtO can be emitted as a combustion byproduct (Kirman et al. 2021) (Figure 9). Because of concerns about potential toxicity from EtO formed through combustion, additional research is needed to determine whether EtO is a byproduct of combustion. If it is, further investigation is necessary to determine the potential emission rates from different types of combustion processes and fuel combinations.
This work can better inform the potential risk to those with the highest exposure to combustion emissions. Descriptions of several combustion sources and information about their potential EtO emissions are provided below.
4.4.1.1 Cigarette Smoke and Vaping
Cigarette smoke (Figure 10) contains more than 70 carcinogens, potentially including EtO (ATSDR 2022d, CDC 2019). Based on elevated levels of EtO hemoglobin adducts in blood samples from smokers compared to the general population, the Agency for Toxic Substances and Disease Registry (ATSDR) suggests that EtO is present in cigarette smoke (CDC 2022, Filser et al. 1992, Jain 2020). A recent literature review (Kirman et al. 2021) provides an overview of the characterization of potential total exposure to EtO via endogenous and exogenous pathways. Studies have also shown that e-cigarettes have been found to contain some of the same carcinogenic compounds as traditional cigarettes. In several studies, analysis of the short-term urinary mercapturic acid metabolite of EtO (HEMA) in e-cigarette users and traditional tobacco smokers reported elevated levels of this metabolite, compared to nonsmokers (Eckert et al. 2011, Frigerio et al. 2020, Jacob et al. 2013, Rubinstein et al. 2018).
4.4.1.2 Wildfires and Prescribed Burning
Emission of EtO is not a known component of smoke from wildfires or prescribed fires (USEPA 2021a, 7-11 to 7-13, Tables 7-8 and 7-9). If EtO is emitted as a byproduct of combustion, then it is possible that combustion of biomass, such as from wildfires, could be a potential source. More research is needed to determine whether this is the case.
4.4.1.3 Fuel Combustion in Mobile and Stationary Sources
A wide variety of fuels such as natural gas, fuel oils, gasoline, coal, and wood are combusted to power both on-road and nonroad motor vehicles, as well as to provide heat and electricity for buildings, homes, and industrial processes. Few published studies focus on EtO emissions from mobile and stationary combustion sources. USEPA currently notes that EtO emissions from mobile exhaust have not been confirmed, but they are working to develop test methods that will allow careful evaluation of this potential combustion source to determine the extent to which EtO may be emitted (USEPA 2023a)
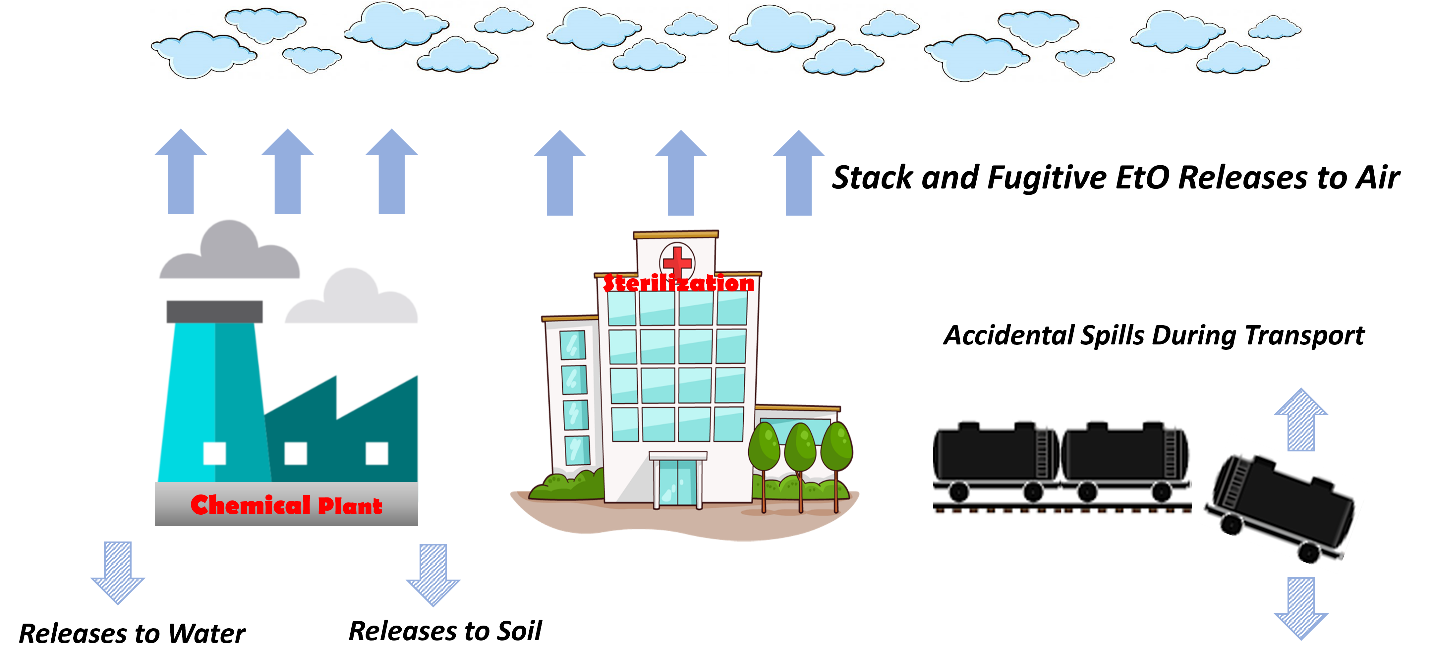
Figure 5. Anthropogenic EtO air emissions from regulated and reportable sources.
Arrows are not to scale. Solid arrows represent major EtO releases. Hatched arrows represent minor potential EtO releases. See USEPA (2022d) and PHMSA (1998) for more information.
Source: Joanna Klapacz/DOW. Used with permission.
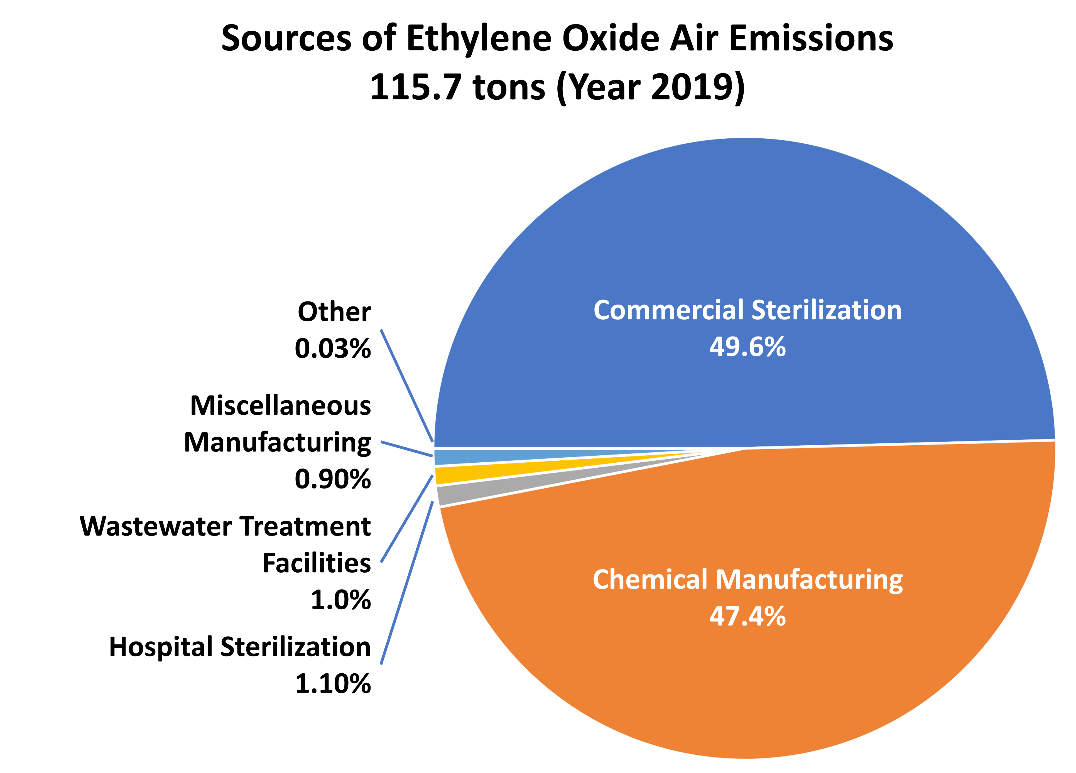
Figure 6. EtO emissions (115.7 tons) by industry for 2019.
This includes TRI, NEI, and RTR data. These are the most up-to-date publicly available information on these sources (USEPA 2021b). The percent contribution of emissions by industries varies from year to year.
Source: (USEPA 2021b).
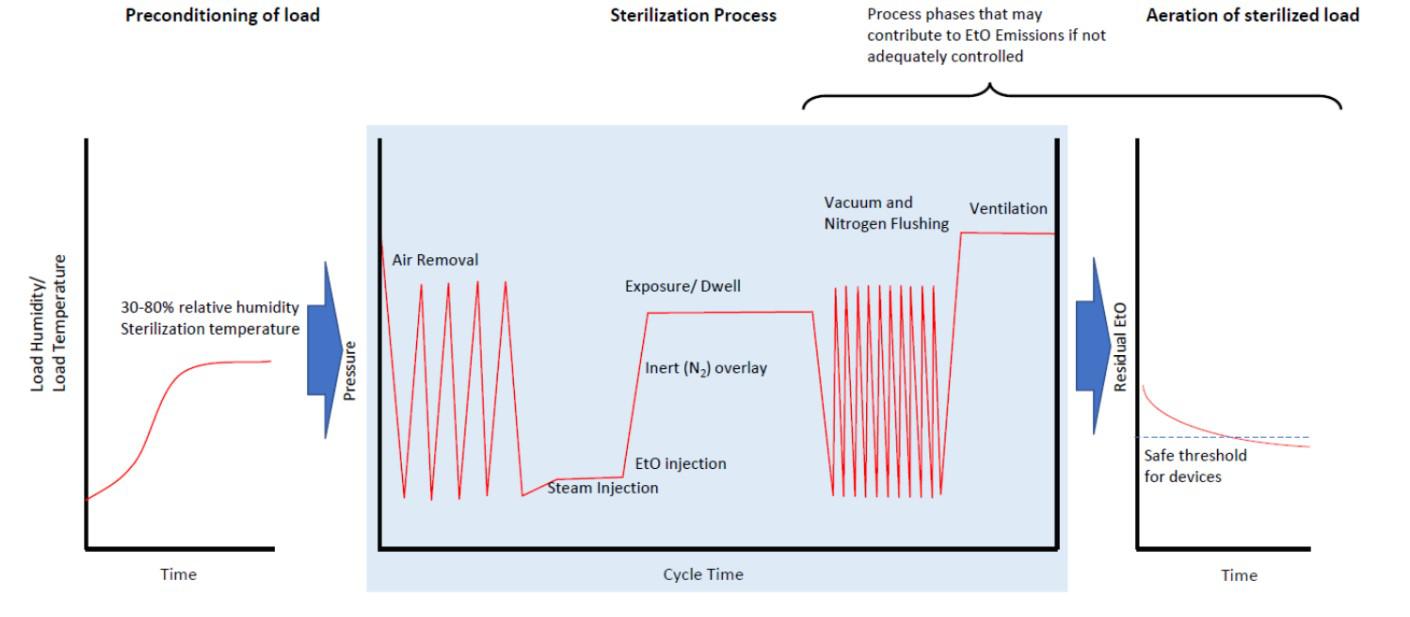

Figure 8. Routes to EtO exposure from known and potential sources.
Figure 8 does not represent the magnitude of source contributions. Image is not to scale and does not represent equivalence in contributions. These sources are documented in Section 5 and appendix. Please click the text in the figure for more information on these sources.
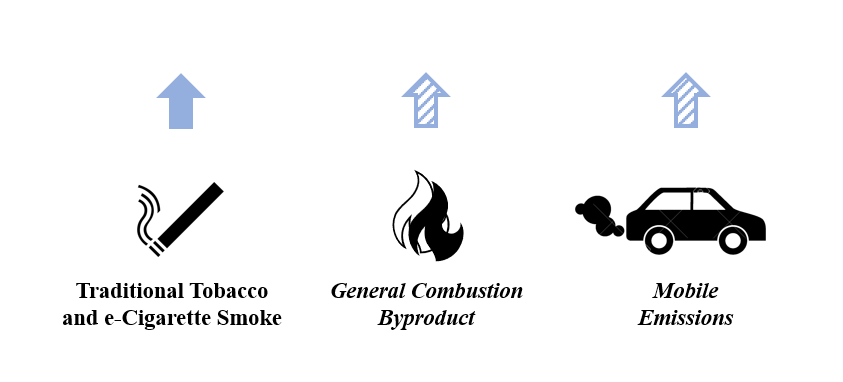
Figure 9. Potential primary and secondary EtO sources from anthropogenic combustion activities.
Arrows are not to scale and do not represent equivalence in contributions. Solid arrows represent documented potential EtO sources. Hatched arrows represent other potential EtO sources. Potential secondary sources of EtO are italicized. As noted above, secondary sources are those that require metabolism or a chemical reaction to produce EtO. Primary sources are those that have been shown to produce EtO directly. Please see these references for more information: mobile emissions (USEPA 2023a), general combustion byproduct (Kirman et al. 2021), cigarette/ecigarette smoke (ATSDR 2022d, a).
Source: Joanna Klapacz/DOW. Used with permission.

Figure 10. Smoke.
Source: Microsoft Stock Images.

5. EtO Emissions Control
Sources of EtO emissions to the atmosphere are regulated under USEPA’s NESHAP rules. The chemical manufacturing and sterilization industries Industry are aiming to reduce EtO emissions with evolving technology and air pollution control equipment to comply with regulations. Different industries use a variety of technologies to lower emissions of EtO. Examples of these technologies include, but are not limited to, those described below. These technologies and their applications to different source types may vary. Best practice is to check with the permitting authority.
5.1 Wet Scrubber / Packed Tower
Wet scrubbers, or packed towers, are devices that help remove pollutants, including EtO, from industrial gas streams (Figure 11). EtO wet scrubbers typically use a low pH liquid spray (scrubbing liquid) composed of water and acid to absorb the gas stream. The acid acts as a catalyst to speed up the reaction of EtO to MEG. The gas is funneled through the bottom of the tower and then passed upward through a bed of packing material and, finally, a mist eliminator before exiting out the top. The wet scrubber typically uses spray nozzles designed to evenly and consistently provide downward-flowing liquid. The packed bed is composed of numerous pieces of packing material and is designed to randomize gas flow, increase surface area, and ensure even dispersion of liquid in the tower by means of liquid surface tension adhesion to the packing material. Packing material can take many different shapes and forms and can be made of either plastics or metals compatible with EtO and with acidic environments. The air laden with EtO flows up through the packing and encounters the liquid, which is then absorbed and falls to the bottom of the tower in a reservoir. Any stray droplets of liquid or mist traveling upward with the airflow contact the mist eliminator and drop back down into the tower. Different styles of mist eliminators, such as mesh or vane type, can be used and are designed for specific flow rates of air. After the absorbed EtO drops into the bottom of the tower it is then pumped to the top of a holding reaction vessel to allow sufficient residence time for the complete conversion of EtO to MEG. The main variable, which determines tower size, is the amount of airflow being handled—the packed bed must provide enough residence time for the EtO to be absorbed by the liquid. Ensuring consistency of flow rate and pH of liquid is important to ensure control remains consistent.
Some of the advantages of wet scrubbers include their ability to handle high-temperature and high-humidity gas streams, their minimal fire and explosion hazards, and their ability to handle large amounts of airflow. They can also achieve a 99% destruction efficiency when the inlet air contains a high concentration of EtO. Disadvantages include corrosion issues caused by the acidic liquid (including air carried over from the tower), freezing concerns with piping in cold temperatures, potential fouling of liquid and packing (due to poor water quality or filtration), high power requirements, disposal of any waste liquid, the cost of acid consumption, and safety needs when troubleshooting or performing maintenance.
5.2 Thermal Oxidizers
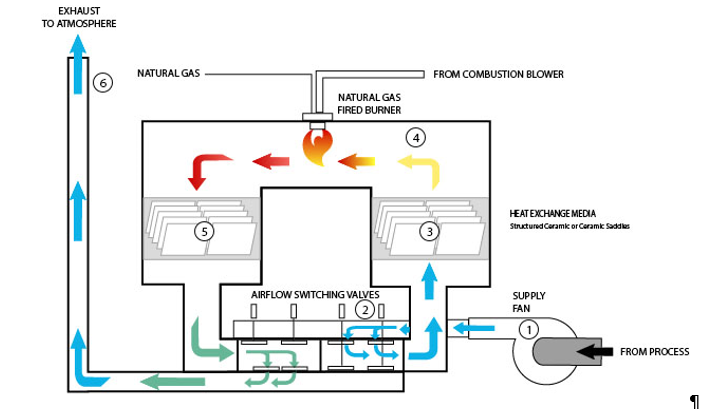
Thermal oxidizers (Figure 12) are used to target volatile organic compounds (VOCs) such as EtO, HAP, and other odorous emissions. Thermal oxidizer systems use high-temperature combustion processes with fuel gas to reach a target temperature range of 760°C (1,400°F) to 820°C (1,510°F) to oxidize air pollutants and turn them into carbon dioxide (CO2) and water, which are then released into the atmosphere. For safety reasons high-concentration streams of EtO are first sent to either a water balancing tank or through a mesh flame arrester before entering the combustion chamber of the thermal oxidizer. Fresh air is continually pushed through the chamber and is mixed with EtO. The natural gas–fueled burners are used for combustion initiation where the introduced EtO accelerates the reaction to produce a high heat release. Some systems also allow for heat regeneration with a heat exchanger—in these units, heat recovery occurs through exchanger media and transfers to a desired endpoint. Once inside the chamber, the EtO-laden air absorbs heat for a sustained period, oxidizing it into CO2 and water vapor. Exhaust air exits through the outlet or in regenerative units through the first combustion chamber and into the second heat exchange to cool before being released into the atmosphere.
Thermal oxidizers can achieve very high levels of destruction efficiency, better than 99%, when handling high concentration inlet streams. Some advantages to thermal oxidizers are their ability to handle high-concentration streams of EtO, smaller installation footprint, ability to potentially recover some of the energy used, and simple operation mechanics. Some disadvantages of thermal oxidizers are the inability to handle high airflow streams, high usage of fuel gas, potential explosion safety concerns that require design control, and potential combustion byproducts introduced to the atmosphere.
5.3 Dry Bed Scrubber
Dry bed scrubbers (Figure 13) use chemically treated polymer beads (reactant media) to permanently convert EtO to a polymer. The reaction is considered a chemisorption process on the surface of the beads where EtO adheres, is adsorbed, and chemically reacts. Like a wet scrubber, air enters the inlet to the dry bed and flows to the outlet as EtO molecules react with the media. Dry beds are sized to handle specific airflow rates to optimize and provide enough residence time for the reaction to take place. When inlet concentrations are greater than 5 ppmv they can achieve greater than 99% destruction efficiency. The air exits the bottom of the media bed through a mesh support screen, which prevents the reactant media from carrying over into the ductwork and catches any stray particulates, similar to a mist eliminator.
Some of the advantages of dry bed scrubbers are the modular ability to add and remove units in line or in series, no power requirements other than a properly sized fan, lower cost, low complexity, permanent conversion of EtO, relatively safe operation and maintenance, and nonhazardous waste disposal. Some disadvantages of dry beds are the inability to handle excessive humidity and very hot heated air streams, limited reaction capacity before reactant media replacement is necessary, and inability to handle concentrations above 5,000 ppmv due to exothermic reaction of media.
5.4 Thermal Flare
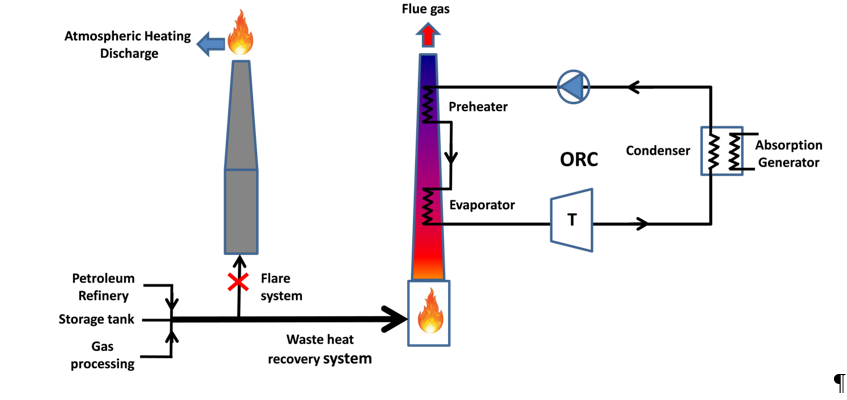
Thermal flares (flares) are used in refineries, chemical plants, and manufacturing to destroy EtO released from normal process vents and safety valve discharges in overpressure situations or EtO in combined air waste streams. Flares are used when EtO is in process, storage, or transfer in industrial air streams in closed vent systems (Figure 14). Flares are specifically configured to handle high-energy process and high VOC streams with excess air for combustion and can have more than a 99% destruction efficiency. Flares operate by continually maintaining a flame by means of fuel gas and then monitoring and adjusting the burn rate measured as Btu/scf (British thermal unit per standard cubic foot) in the combustion zone to meet a specific net heating value of the combustion zone gas for the combined airstream. Appropriate dosing of EtO can be accomplished by using a vaporization vessel where liquid EtO is converted to gas and then diluted with another gas such as nitrogen or methane. When EtO enters the combustion zone it reacts and is broken down into CO2, water, and other compounds before exiting the discharge stack. Some flares include a post-flare waste-heat recovery system where a generator recovers heat as the exhaust gases cool by means of a heat exchanger. Flares often have an externally visible flame, but some flares may be enclosed. Flares can be vertical or horizontal.
Some advantages to flares are the ability to handle highly complex processes, the ability to handle combined emissions streams, the ability to handle interval variable inputs, and potential heat recovery. Some disadvantages to flares include high gas utility usage, possible unsightly external flames, complex maintenance parameters, integration complexity with processes, and potential flashback risks. To prevent flashback, several options are often utilized in tandem such as diluting the gas stream to a non-decomposable mixture, liquid seals or tanks, flame arresters, flame flashback plates, and monitoring/control of flare velocity. Many times, these systems are continually monitored to add safety redundancy and shut down the system if a problem is present. Please refer to the individual NESHAPs for the definition of flare.
5.5 Bubbling Scrubbers
Bubbling scrubbers (Figure 15) work by means of reacting EtO gas streams with a low pH mixture of water and acid. The chemical reaction of water and EtO converts it to MEG, and the acid acts as a catalyst to speed up the reaction. The process starts by pumping low-flow gas streams laden with EtO to the bottom of a reactant tank, often called a first stage or snubber tank. EtO is bubbled through the bottom by means of perforated diffusing holes that create and allow fine bubbles to rise to the headspace of the tank. The residence time of the bubbles in the tank allows the reaction to take place. The headspace from the first stage pushes into a second-stage tank that repeats the initial process. The headspace of the final tank must remain in negative pressure by means of a centrifugal blower to either further controls or a stack. Bubbling scrubbers create MEG that accumulates in the tanks and increases liquid levels and can decrease conversion efficiency if it is too high. Monitoring of these systems is important to maintain appropriate control.
As MEG is formed, the liquid level and specific gravity of the solution increase. Either of these variables may be used as a proxy for glycol concentration to establish operating limits of a system. Although temperature may affect the rate of the chemical reaction, this is a secondary parameter. The pH of the solution is not significantly affected as the concentration of glycol increases, but a decrease in pH can be an indication of a system failure. MEG transfer occurs on occasion to regenerate reactant tanks with fresh water and acid. After MEG is transferred, MEG neutralization occurs with a base before final disposal. Bubbling scrubbers provide 99–99.9% destruction efficiency. Some advantages to bubbling scrubbers are the intrinsic safety of a liquid system, ability to control EtO emissions consistently and efficiently if parametric variables are maintained, ability to handle high-concentration and low-air flow streams well, few points of failure, and low complexity of maintenance. Some disadvantages of bubbling scrubbers are the inability to handle high amounts of airflow, safety risks from handling acids and bases in the process, the cost of acid consumption, and final handling of MEG solution.
Bubbling scrubbers should not be confused with balancing tanks (peak shaver). Balancing tanks hold EtO-laden water but do not react EtO to MEG. Balancing tanks retain EtO so it can be sent at optimal levels for downstream abatement technology.
5.6 Catalytic Oxidizer
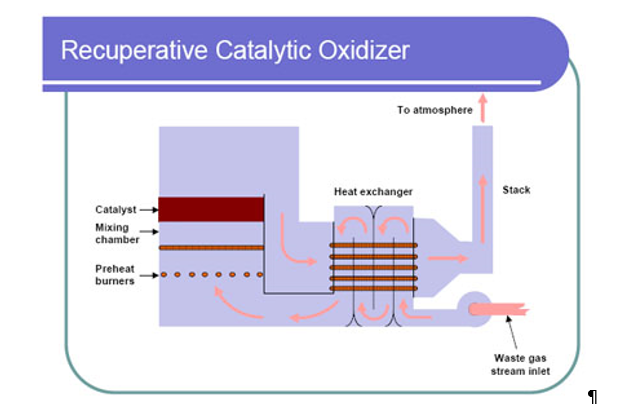
Catalytic oxidizers are air pollution control systems that use catalysts to treat VOCs (Figure 16). The catalyst is composed of specific metals and oxides designed to optimally promote oxidization of EtO to CO2 and water at much lower temperatures than a more traditional straight thermal oxidation. This is because catalytic oxidizers can maintain a continuous, steady operating state for indefinite periods of time, which allows for great increases in temperature and pressure rates. They are most effective for low concentrations of EtO and temperature ranges between 150°C (300°F) and 400°C (752°F), which is a range where EtO is combusted but sintering of the catalyst does not occur.
In the catalytic oxidization process, the gas enters the oxidizer chamber and gets heated; the temperature varies based on the contaminant and type of catalyst. After it reaches the appropriate catalyst activation temperature, the EtO laden air is exposed to excess oxygen before breaking down the contaminants into CO2, water vapor, and thermal energy and then exits the catalyst.
Catalytic oxidizers can be outfitted with heat exchangers to recover heat from the system for other uses. They provide a 99–99.9% destruction efficiency. Some of the advantages of the catalytic oxidizer are that they generate far fewer nitrogen oxides and carbon monoxides than other thermal oxidizers because they require much lower gas consumption and cooler temperature levels to achieve the same result, allowing for a more energy efficient operation; contain potential heat recovery options; and are an environmentally friendly process (USEPA 2022i). Some disadvantages of catalytic oxidizers are that the catalyst may become poisoned by the introduction of sulfates or silica byproducts, they have a larger unit footprint, and the require utility use of gas to sustain operations.
5.7 Limitations and Challenges of EtO Control Equipment Deployment
It is important to understand the common challenges of EtO control equipment and installation of such equipment. The most common limiting factors for equipment are inlet concentration limitations, overcoming differential pressure, utility usage, and space/storage constraints.
USEPA acknowledges inlet concentration limitations in their air pollution control technology fact sheets for thermal oxidizers and wet scrubbers (USEPA 2003a, b, c). Concentration destruction removal efficiency follows a decay curve where diminished removal efficiency occurs in the sub-ppm/ppb range. The diminished efficiency may be the result of the higher probability that fewer EtO molecules will achieve adequate residence time chemically or exothermically due to Brownian-type motion in the sub-ppm/ppb range. These limits are technology and equipment specific.
Abatement technologies create differential pressure that must be overcome. Resistance in reactant materials or filters creates the pressure. For example, there is resistance to overcome with dry bed media and filters, packed tower packing and mist eliminators, and catalysts in oxidizers. Ductwork creates resistance that increases with smaller diameters of ducting and any added bends or elbows. Over time, things like buildup of dust or deposits on abatement equipment can also create added resistance. A properly sized fan is required for any technology—the fan must create enough negative pressure and flow rate to overcome the total system resistance while also achieving proper residence time in the equipment for reaction to occur.
Utility usage can constrain deployment of abatement equipment, and access to an adequate power supply or natural gas can become a limiting factor in choice of equipment type. Access to proper utilities may be complicated by land use restrictions, ordinances, and easements. Likewise, the larger the amount of airflow controlled by abatement equipment, the larger the equipment size needed. This may become a potential limiting factor in choice of equipment due to space/storage constraints.
5.8 Layering Control Technologies
Control technologies can be layered to achieve redundancy and greater control efficiency and overcome limitations of equipment. This can be particularly effective in higher concentration situations where “polishing” of emissions has a larger impact.
It is important to understand that each technology has optimal inlet ranges for variables such as temperature and relative humidity. Furthermore, the consistency of variables must be considered. For example, many systems cannot operate properly if fluctuations of airflow rate or static pressure are too great.
When layering technologies, the safety and control of the inlet variables and inlet concentrations are the primary considerations. A comprehensive review of all situations and equipment in line are critical. This must include factors such as potential acid carry-over; byproducts of combustion; backflow; construction materials for piping, ducting, and equipment (e.g., booster fans and pumps); and failure of primary equipment and secondary control inlet concentration loading.
5.9 Safe Usage of Emissions Control Systems
Several historic incidents of major damage due to explosion, overloading, or rapid decomposition of EtO entering abatement systems have occurred in the past.
To prevent catastrophic incidents from occurring, OSHA has a threshold of 5,000 lbs of EtO at which the location must develop a comprehensive process safety management program to address risks and related hazards. The process hazard analysis portion of the standard requires a systematic review of the safe operations of the emissions controls and ancillary equipment. Many situations, both internal and external to the process, can cause excess risk or failure.
It is important to review both historic incidents and specific equipment-type failures that can occur and mitigate for any likely risks specific to the location’s operation. The ACC released a Product Stewardship Guidance Manual that outlines specific risks for emissions control systems in Sections 4.8 and 5.8 of the manual (ACC 2023b).
Sources of EtO emissions to the atmosphere are regulated under USEPA’s NESHAP rules. The chemical manufacturing and sterilization industries Industry are aiming to reduce EtO emissions with evolving technology and air pollution control equipment to comply with regulations. Different industries use a variety of technologies to lower emissions of EtO. Examples of these technologies include, but are not limited to, those described below. These technologies and their applications to different source types may vary. Best practice is to check with the permitting authority.
5.1 Wet Scrubber / Packed Tower
Wet scrubbers, or packed towers, are devices that help remove pollutants, including EtO, from industrial gas streams (Figure 11). EtO wet scrubbers typically use a low pH liquid spray (scrubbing liquid) composed of water and acid to absorb the gas stream. The acid acts as a catalyst to speed up the reaction of EtO to MEG. The gas is funneled through the bottom of the tower and then passed upward through a bed of packing material and, finally, a mist eliminator before exiting out the top. The wet scrubber typically uses spray nozzles designed to evenly and consistently provide downward-flowing liquid. The packed bed is composed of numerous pieces of packing material and is designed to randomize gas flow, increase surface area, and ensure even dispersion of liquid in the tower by means of liquid surface tension adhesion to the packing material. Packing material can take many different shapes and forms and can be made of either plastics or metals compatible with EtO and with acidic environments. The air laden with EtO flows up through the packing and encounters the liquid, which is then absorbed and falls to the bottom of the tower in a reservoir. Any stray droplets of liquid or mist traveling upward with the airflow contact the mist eliminator and drop back down into the tower. Different styles of mist eliminators, such as mesh or vane type, can be used and are designed for specific flow rates of air. After the absorbed EtO drops into the bottom of the tower it is then pumped to the top of a holding reaction vessel to allow sufficient residence time for the complete conversion of EtO to MEG. The main variable, which determines tower size, is the amount of airflow being handled—the packed bed must provide enough residence time for the EtO to be absorbed by the liquid. Ensuring consistency of flow rate and pH of liquid is important to ensure control remains consistent.
Some of the advantages of wet scrubbers include their ability to handle high-temperature and high-humidity gas streams, their minimal fire and explosion hazards, and their ability to handle large amounts of airflow. They can also achieve a 99% destruction efficiency when the inlet air contains a high concentration of EtO. Disadvantages include corrosion issues caused by the acidic liquid (including air carried over from the tower), freezing concerns with piping in cold temperatures, potential fouling of liquid and packing (due to poor water quality or filtration), high power requirements, disposal of any waste liquid, the cost of acid consumption, and safety needs when troubleshooting or performing maintenance.
5.2 Thermal Oxidizers
Thermal oxidizers (Figure 12) are used to target volatile organic compounds (VOCs) such as EtO, HAP, and other odorous emissions. Thermal oxidizer systems use high-temperature combustion processes with fuel gas to reach a target temperature range of 760°C (1,400°F) to 820°C (1,510°F) to oxidize air pollutants and turn them into carbon dioxide (CO2) and water, which are then released into the atmosphere. For safety reasons high-concentration streams of EtO are first sent to either a water balancing tank or through a mesh flame arrester before entering the combustion chamber of the thermal oxidizer. Fresh air is continually pushed through the chamber and is mixed with EtO. The natural gas–fueled burners are used for combustion initiation where the introduced EtO accelerates the reaction to produce a high heat release. Some systems also allow for heat regeneration with a heat exchanger—in these units, heat recovery occurs through exchanger media and transfers to a desired endpoint. Once inside the chamber, the EtO-laden air absorbs heat for a sustained period, oxidizing it into CO2 and water vapor. Exhaust air exits through the outlet or in regenerative units through the first combustion chamber and into the second heat exchange to cool before being released into the atmosphere.
Thermal oxidizers can achieve very high levels of destruction efficiency, better than 99%, when handling high concentration inlet streams. Some advantages to thermal oxidizers are their ability to handle high-concentration streams of EtO, smaller installation footprint, ability to potentially recover some of the energy used, and simple operation mechanics. Some disadvantages of thermal oxidizers are the inability to handle high airflow streams, high usage of fuel gas, potential explosion safety concerns that require design control, and potential combustion byproducts introduced to the atmosphere.
5.3 Dry Bed Scrubber
Dry bed scrubbers (Figure 13) use chemically treated polymer beads (reactant media) to permanently convert EtO to a polymer. The reaction is considered a chemisorption process on the surface of the beads where EtO adheres, is adsorbed, and chemically reacts. Like a wet scrubber, air enters the inlet to the dry bed and flows to the outlet as EtO molecules react with the media. Dry beds are sized to handle specific airflow rates to optimize and provide enough residence time for the reaction to take place. When inlet concentrations are greater than 5 ppmv they can achieve greater than 99% destruction efficiency. The air exits the bottom of the media bed through a mesh support screen, which prevents the reactant media from carrying over into the ductwork and catches any stray particulates, similar to a mist eliminator.
Some of the advantages of dry bed scrubbers are the modular ability to add and remove units in line or in series, no power requirements other than a properly sized fan, lower cost, low complexity, permanent conversion of EtO, relatively safe operation and maintenance, and nonhazardous waste disposal. Some disadvantages of dry beds are the inability to handle excessive humidity and very hot heated air streams, limited reaction capacity before reactant media replacement is necessary, and inability to handle concentrations above 5,000 ppmv due to exothermic reaction of media.
5.4 Thermal Flare
Thermal flares (flares) are used in refineries, chemical plants, and manufacturing to destroy EtO released from normal process vents and safety valve discharges in overpressure situations or EtO in combined air waste streams. Flares are used when EtO is in process, storage, or transfer in industrial air streams in closed vent systems (Figure 14). Flares are specifically configured to handle high-energy process and high VOC streams with excess air for combustion and can have more than a 99% destruction efficiency. Flares operate by continually maintaining a flame by means of fuel gas and then monitoring and adjusting the burn rate measured as Btu/scf (British thermal unit per standard cubic foot) in the combustion zone to meet a specific net heating value of the combustion zone gas for the combined airstream. Appropriate dosing of EtO can be accomplished by using a vaporization vessel where liquid EtO is converted to gas and then diluted with another gas such as nitrogen or methane. When EtO enters the combustion zone it reacts and is broken down into CO2, water, and other compounds before exiting the discharge stack. Some flares include a post-flare waste-heat recovery system where a generator recovers heat as the exhaust gases cool by means of a heat exchanger. Flares often have an externally visible flame, but some flares may be enclosed. Flares can be vertical or horizontal.
Some advantages to flares are the ability to handle highly complex processes, the ability to handle combined emissions streams, the ability to handle interval variable inputs, and potential heat recovery. Some disadvantages to flares include high gas utility usage, possible unsightly external flames, complex maintenance parameters, integration complexity with processes, and potential flashback risks. To prevent flashback, several options are often utilized in tandem such as diluting the gas stream to a non-decomposable mixture, liquid seals or tanks, flame arresters, flame flashback plates, and monitoring/control of flare velocity. Many times, these systems are continually monitored to add safety redundancy and shut down the system if a problem is present. Please refer to the individual NESHAPs for the definition of flare.
5.5 Bubbling Scrubbers
Bubbling scrubbers (Figure 15) work by means of reacting EtO gas streams with a low pH mixture of water and acid. The chemical reaction of water and EtO converts it to MEG, and the acid acts as a catalyst to speed up the reaction. The process starts by pumping low-flow gas streams laden with EtO to the bottom of a reactant tank, often called a first stage or snubber tank. EtO is bubbled through the bottom by means of perforated diffusing holes that create and allow fine bubbles to rise to the headspace of the tank. The residence time of the bubbles in the tank allows the reaction to take place. The headspace from the first stage pushes into a second-stage tank that repeats the initial process. The headspace of the final tank must remain in negative pressure by means of a centrifugal blower to either further controls or a stack. Bubbling scrubbers create MEG that accumulates in the tanks and increases liquid levels and can decrease conversion efficiency if it is too high. Monitoring of these systems is important to maintain appropriate control.
As MEG is formed, the liquid level and specific gravity of the solution increase. Either of these variables may be used as a proxy for glycol concentration to establish operating limits of a system. Although temperature may affect the rate of the chemical reaction, this is a secondary parameter. The pH of the solution is not significantly affected as the concentration of glycol increases, but a decrease in pH can be an indication of a system failure. MEG transfer occurs on occasion to regenerate reactant tanks with fresh water and acid. After MEG is transferred, MEG neutralization occurs with a base before final disposal. Bubbling scrubbers provide 99–99.9% destruction efficiency. Some advantages to bubbling scrubbers are the intrinsic safety of a liquid system, ability to control EtO emissions consistently and efficiently if parametric variables are maintained, ability to handle high-concentration and low-air flow streams well, few points of failure, and low complexity of maintenance. Some disadvantages of bubbling scrubbers are the inability to handle high amounts of airflow, safety risks from handling acids and bases in the process, the cost of acid consumption, and final handling of MEG solution.
Bubbling scrubbers should not be confused with balancing tanks (peak shaver). Balancing tanks hold EtO-laden water but do not react EtO to MEG. Balancing tanks retain EtO so it can be sent at optimal levels for downstream abatement technology.
5.6 Catalytic Oxidizer
Catalytic oxidizers are air pollution control systems that use catalysts to treat VOCs (Figure 16). The catalyst is composed of specific metals and oxides designed to optimally promote oxidization of EtO to CO2 and water at much lower temperatures than a more traditional straight thermal oxidation. This is because catalytic oxidizers can maintain a continuous, steady operating state for indefinite periods of time, which allows for great increases in temperature and pressure rates. They are most effective for low concentrations of EtO and temperature ranges between 150°C (300°F) and 400°C (752°F), which is a range where EtO is combusted but sintering of the catalyst does not occur.
In the catalytic oxidization process, the gas enters the oxidizer chamber and gets heated; the temperature varies based on the contaminant and type of catalyst. After it reaches the appropriate catalyst activation temperature, the EtO laden air is exposed to excess oxygen before breaking down the contaminants into CO2, water vapor, and thermal energy and then exits the catalyst.
Catalytic oxidizers can be outfitted with heat exchangers to recover heat from the system for other uses. They provide a 99–99.9% destruction efficiency. Some of the advantages of the catalytic oxidizer are that they generate far fewer nitrogen oxides and carbon monoxides than other thermal oxidizers because they require much lower gas consumption and cooler temperature levels to achieve the same result, allowing for a more energy efficient operation; contain potential heat recovery options; and are an environmentally friendly process (USEPA 2022i). Some disadvantages of catalytic oxidizers are that the catalyst may become poisoned by the introduction of sulfates or silica byproducts, they have a larger unit footprint, and the require utility use of gas to sustain operations.
5.7 Limitations and Challenges of EtO Control Equipment Deployment
It is important to understand the common challenges of EtO control equipment and installation of such equipment. The most common limiting factors for equipment are inlet concentration limitations, overcoming differential pressure, utility usage, and space/storage constraints.
USEPA acknowledges inlet concentration limitations in their air pollution control technology fact sheets for thermal oxidizers and wet scrubbers (USEPA 2003a, b, c). Concentration destruction removal efficiency follows a decay curve where diminished removal efficiency occurs in the sub-ppm/ppb range. The diminished efficiency may be the result of the higher probability that fewer EtO molecules will achieve adequate residence time chemically or exothermically due to Brownian-type motion in the sub-ppm/ppb range. These limits are technology and equipment specific.
Abatement technologies create differential pressure that must be overcome. Resistance in reactant materials or filters creates the pressure. For example, there is resistance to overcome with dry bed media and filters, packed tower packing and mist eliminators, and catalysts in oxidizers. Ductwork creates resistance that increases with smaller diameters of ducting and any added bends or elbows. Over time, things like buildup of dust or deposits on abatement equipment can also create added resistance. A properly sized fan is required for any technology—the fan must create enough negative pressure and flow rate to overcome the total system resistance while also achieving proper residence time in the equipment for reaction to occur.
Utility usage can constrain deployment of abatement equipment, and access to an adequate power supply or natural gas can become a limiting factor in choice of equipment type. Access to proper utilities may be complicated by land use restrictions, ordinances, and easements. Likewise, the larger the amount of airflow controlled by abatement equipment, the larger the equipment size needed. This may become a potential limiting factor in choice of equipment due to space/storage constraints.
5.8 Layering Control Technologies
Control technologies can be layered to achieve redundancy and greater control efficiency and overcome limitations of equipment. This can be particularly effective in higher concentration situations where “polishing” of emissions has a larger impact.
It is important to understand that each technology has optimal inlet ranges for variables such as temperature and relative humidity. Furthermore, the consistency of variables must be considered. For example, many systems cannot operate properly if fluctuations of airflow rate or static pressure are too great.
When layering technologies, the safety and control of the inlet variables and inlet concentrations are the primary considerations. A comprehensive review of all situations and equipment in line are critical. This must include factors such as potential acid carry-over; byproducts of combustion; backflow; construction materials for piping, ducting, and equipment (e.g., booster fans and pumps); and failure of primary equipment and secondary control inlet concentration loading.
5.9 Safe Usage of Emissions Control Systems
Several historic incidents of major damage due to explosion, overloading, or rapid decomposition of EtO entering abatement systems have occurred in the past.
To prevent catastrophic incidents from occurring, OSHA has a threshold of 5,000 lbs of EtO at which the location must develop a comprehensive process safety management program to address risks and related hazards. The process hazard analysis portion of the standard requires a systematic review of the safe operations of the emissions controls and ancillary equipment. Many situations, both internal and external to the process, can cause excess risk or failure.
It is important to review both historic incidents and specific equipment-type failures that can occur and mitigate for any likely risks specific to the location’s operation. The ACC released a Product Stewardship Guidance Manual that outlines specific risks for emissions control systems in Sections 4.8 and 5.8 of the manual (ACC 2023b).
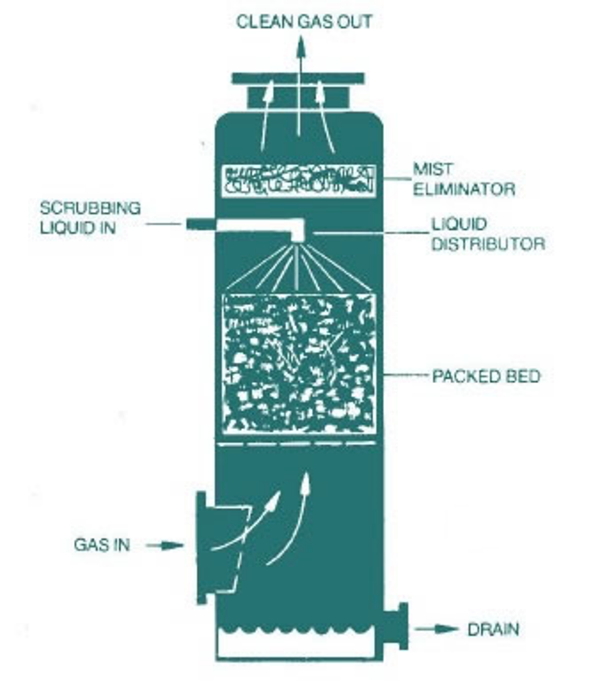
Figure 11. Packed tower.
Source: CR Clean Air. Used with permission of The Clean Air Group, LLC, www.crcleanair.com.
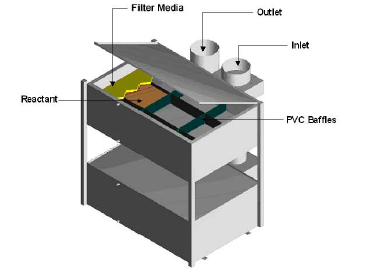
Figure 13. Dry bed scrubber.
Source: Advanced Air Technologies. Used with permission.
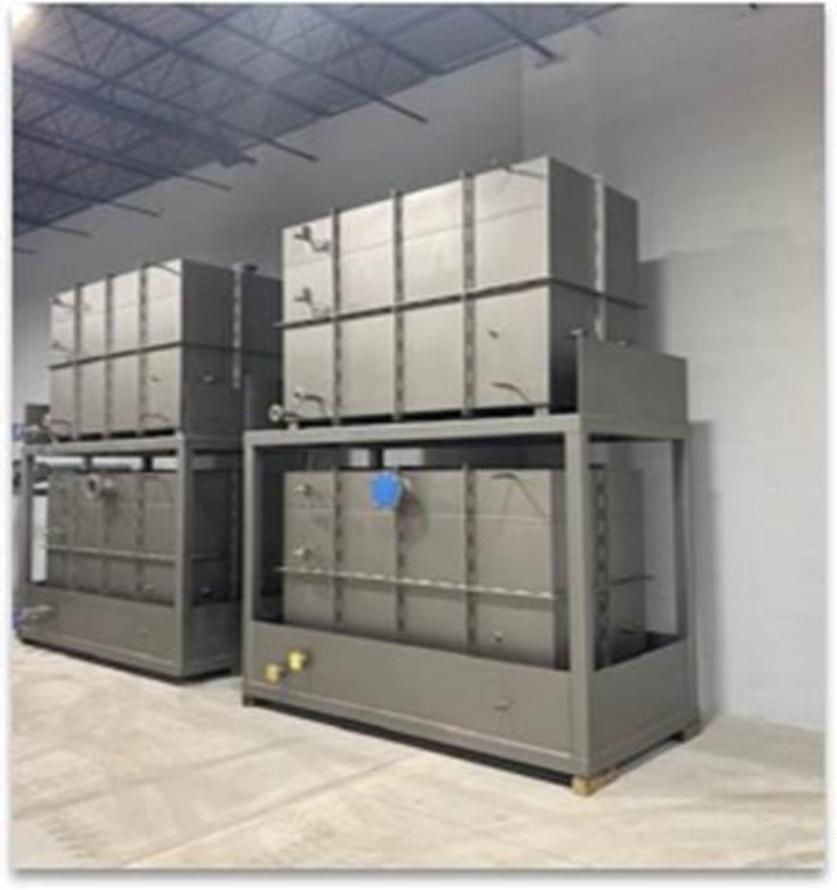
Figure 15. Bubbling scrubber.
Source: Cosmed. Used with permission.

6. Sampling, Measurements and Analysis of EtO
6.1 Introduction
Determining EtO concentrations in the environment is important in a variety of contexts, including understanding whether a given facility is compliant with workplace safety standards and environmental regulations, determining the effectiveness of emissions controls, etc. Background EtO for the purposes of this guide is defined as EtO in ambient air that is not clearly linked to any known or suspected source, such as a chemical plant or commercial sterilizer. Pollutant concentrations can be determined through direct measurement or modeling. Modeling is a mathematical estimation or simulation used to predict how chemicals behave under different environmental conditions. Direct measurement, on the other hand, involves the physical collection and analysis of samples. Together, environmental measurements and modeling contribute to the development of a greater understanding of EtO and its distribution in the environment (Table 2).
Table 2. Key functions of measurement vs. modeling of EtO
| Measurement | Modeling |
|
|
Additional Resources:
- Information on sampling, measurements and analysis for OSHA compliance can be found at this link (OSHA 2023e).
- Information on air modeling can be found at this link (USEPA 2023e).
For EtO, the principal aim of modeling and measurements is to understand its concentration in air, which means understanding its concentrations in the atmosphere under different climatological conditions, emission rates, and facility operating scenarios.
Air dispersion models consider EtO across wide spatial scales (e.g., communities) rather than at individual monitoring locations. Air modeling is commonly used as a tool for assessing risk; however, air quality measurements are important to corroborate model results (USEPA 2023a). Measurements are also important for determining EtO concentration levels in the ambient air at the sampled locations and compliance with regulatory requirements (e.g., source emission tests). It should be noted that sampling, measurements, and analysis (whether ambient or source sampling) are a snapshot of the EtO concentration or emissions at the time the sampling was conducted.
The purpose of this section of the guide is to describe EtO air sampling, measurements, and analysis techniques to gain a better understanding of emissions of EtO from sources (stack emissions) as well as overall ambient air quality. Sampling, measurements, and analysis can be accomplished by a variety of parties for a broad range of locations (Figure 17), including near industrial areas or in communities.
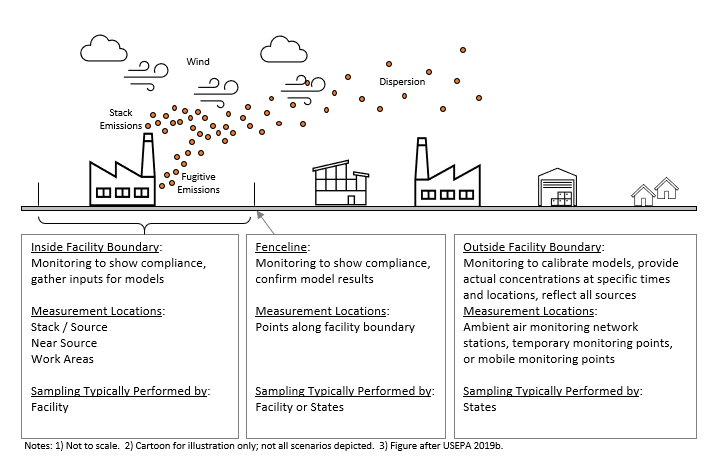
Figure 17. Examples of different types of monitoring locations.
Source: GSI Environmental. Used with permission.
A variety of sampling, measurements, and analysis methods measure EtO. Analysis can be performed both in the laboratory and directly in the field. The method applied depends on the application and need for analysis. Before sampling, some things to consider would be the expected concentration level, analytical performance, proximity to known source, potential interference(s), expected use of the data, and other logistical considerations. The objective of this section is to identify methods available to measure EtO and some of the underlying principles of these methodologies.
Specific information on sampling, analytical techniques, and instrumentation can be found in a presentation given by Peter Kariher of the USEPA Office of Research and Development / Center for Environmental Measurement and Modeling for the 2022 National Ambient Air Monitoring Conference (USEPA 2022m).
According to the 2022 ITRC EtO State Survey (ITRC 2022), most states collect air samples in canisters for laboratory analysis using USEPA Toxic Organics (TO)-15(1999) or TO-15A(2019) methods (USEPA 1999). Field instruments with on-site analyses are also used for measurement of source and near-source emissions, including gas chromatographs, cavity ring-down spectroscopy (CRDS), and Fourier-transfer infrared spectrometry (FTIR) (ITRC 2022, Q12).
6.2 Coniderations for Planning and Implementing an EtO Sampling Program
Sampling, measurement, and analysis techniques for EtO continue to evolve as technologies improve. For the most current USEPA information and guidance concerning ambient sampling of EtO, the reader should consult USEPA’s Air Toxics Ambient Monitoring website (USEPA 2023g), USEPA’s Air Emissions Measurement Center source sampling website (USEPA 2023d), and USEPA’s Guidance on Systematic Planning Using the Data Quality Objectives Process (USEPA 2023q). It is advisable to develop agency-specific quality assurance project plans (USEPA 2023n). When planning to measure EtO, many details should be considered. These include, but are not limited to, the following:
- Expected EtO concentration level, which can be influenced by
- proximity to sources
- sampling locations
- atmospheric and meteorological conditions
- landscape and topography
- Proximity to known source
- in-stack sampling at the source
- near-source fugitive emissions
- near source / fence line
- background (see Section 1.1.2)
- community
- Analytical performance
- method detection limit or sensitivity
- repeatability
- robustness
- accuracy and precision (Figure 18)
- selectivity
- analytical background
- Potential sampling and measurement challenges
- moisture (in-stack sampling)
- humidity (canister sampling)
- co-eluting compounds (compounds that cannot be resolved from one another in EtO analysis and quantification)
- canister bias or formation of EtO in certain sampling canisters (see Section 6.5.1 for more information)
- Expected data use (see Section 6.6)
- user experience and expertise
- level of quality assurance / quality control required
- Other logistical concerns
- available power
- available climate-controlled facilities
- security and access
- facility operations (if applicable)
- environmental conditions (e.g., weather)

The details discussed above are examples of items that should be considered as the sampling program for EtO is developed. These examples identify common concerns, but this list is not inclusive of all field and measurement variables likely to be encountered. As discussed above, EtO sampling may have either a laboratory analysis or a field analysis portion or both. Examples of various measurement techniques and types of instrumentation are shown in this presentation but should not be construed to be all-encompassing (USEPA 2022m). While these tables provide a variety of options, EtO measurement techniques are rapidly changing, and this information may not be inclusive of all available technologies. Please note that mention of any trade names in this guide does not constitute a recommendation but are provided for the user’s reference and information.
Selection of a particular sampling approach and instrumentation or method type will be guided by the expected concentrations and the logistics of the measurement location(s). In general, there are more options for near-source sampling, measurements, and analysis because concentrations are typically higher closer to a known source. Field instruments with on-site analysis capabilities and sample collection devices paired with subsequent laboratory analyses may be available that can meet applicable method performance requirements; these are referenced in this presentation (USEPA 2022m). Given the current measurement technologies for ambient air, where EtO concentrations are expected to be low, laboratory analysis may be required instead of on-site field analysis.
Another item listed above to be considered is the duration of the sample collection. For source (e.g., stack) measurements, sample collection covering a batch process or an hour (if a continuous process) may be sufficient. For ambient or fence-line sampling, samples collected over a 24-hour period might be more appropriate so the data can be compared to national data sets. Although 24-hour durations are often used for ambient or fence-line sampling, collecting grab samples can also be useful to understand EtO concentrations from events that might occur over shorter time intervals. Meteorological data may be informative in ambient field study planning, such as determining sampling frequency and duration. For example, nearby airports or Automated Surface Observing Stations (ASOS) can be used to provide meteorological data, which is useful to identify potential influences on measured concentrations.
The predominant wind direction is another consideration that should be factored into decisions on sampling type and location. Using nearby wind data from local airports or ASOS stations, the annual primary and secondary wind directions can be determined. When sampling near a source, the sampling sites can be in the primary upwind, primary downwind, secondary upwind, and secondary downwind directions relative to the source of EtO. An example of a wind rose is shown below (Figure 19).
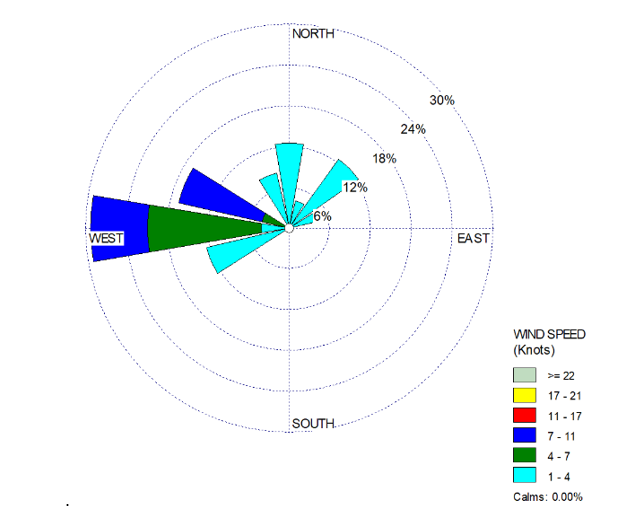
For further information on how to interpret and read wind roses, the reader can refer to this USEPA document (USEPA 2019c). Measurements that are paired with wind direction and speed from nearby meteorological stations will provide the end user with critical information about what might be contributing to the measured concentration. (Wind speed and direction are not applicable to in-stack sampling.)
As the sampling plan is being developed, the purpose of, or end use for, the data collection must be considered. The following question should be asked: Are these data being collected to provide fence-line information, characterize concentrations in a community, or provide ambient concentrations? The objectives for the data being collected will guide the specific sample locations, the number of samples needed, sampling frequency and duration, and quality control and assurance actions taken. If possible, routine comparisons among samples should be performed. This comparison could be in the form of collocated samples or samples at varying distances from the EtO source.
Determining the concentration from areas that are not influenced by sources of EtO (e.g., upwind) is also important to understand and interpret the data from the samples collected. The data should be representative of the area, and multiple samples should be considered to obtain a more complete understanding of the EtO concentration in areas in communities or near a source. Since EtO is challenging to measure at extremely low-level concentrations, a larger data set could provide higher-quality results because inconsistencies can be evaluated more meaningfully.
In order to consider other potential logistical concerns, the sampling program should plan for the following:
6.2 Coniderations for Planning and Implementing an EtO Sampling Program
Sampling, measurement, and analysis techniques for EtO continue to evolve as technologies improve. For the most current USEPA information and guidance concerning ambient sampling of EtO, the reader should consult USEPA’s Air Toxics Ambient Monitoring website (USEPA 2023g), USEPA’s Air Emissions Measurement Center source sampling website (USEPA 2023d), and USEPA’s Guidance on Systematic Planning Using the Data Quality Objectives Process (USEPA 2023q). It is advisable to develop agency-specific quality assurance project plans (USEPA 2023n). When planning to measure EtO, many details should be considered. These include, but are not limited to, the following:
-
- Expected EtO concentration level, which can be influenced by
-
- proximity to sources
-
- sampling locations
-
- atmospheric and meteorological conditions
-
- landscape and topography
-
- Expected EtO concentration level, which can be influenced by
-
- Proximity to known source
-
- in-stack sampling at the source
-
- near-source fugitive emissions
-
- near source / fence line
-
- background (see Section 1.1.2)
-
- community
-
- Proximity to known source
-
- Analytical performance
-
- method detection limit or sensitivity
-
- repeatability
-
- robustness
-
- accuracy and precision (Figure 18)
-
- selectivity
-
- analytical background
-
- Analytical performance
-
- Potential sampling and measurement challenges
-
- moisture (in-stack sampling)
-
- humidity (canister sampling)
-
- co-eluting compounds (compounds that cannot be resolved from one another in EtO analysis and quantification)
-
- canister bias or formation of EtO in certain sampling canisters (see Section 6.5.1 for more information)
-
- Potential sampling and measurement challenges
-
- Expected data use (see Section 6.6)
-
- user experience and expertise
-
- level of quality assurance / quality control required
-
- Expected data use (see Section 6.6)
-
- Other logistical concerns
-
- available power
-
- available climate-controlled facilities
-
- security and access
-
- facility operations (if applicable)
-
- environmental conditions (e.g., weather)
-
- Other logistical concerns
The details discussed above are examples of items that should be considered as the sampling program for EtO is developed. These examples identify common concerns, but this list is not inclusive of all field and measurement variables likely to be encountered. As discussed above, EtO sampling may have either a laboratory analysis or a field analysis portion or both. Examples of various measurement techniques and types of instrumentation are shown in this presentation but should not be construed to be all-encompassing (USEPA 2022m). While these tables provide a variety of options, EtO measurement techniques are rapidly changing, and this information may not be inclusive of all available technologies. Please note that mention of any trade names in this guide does not constitute a recommendation but are provided for the user’s reference and information.
Selection of a particular sampling approach and instrumentation or method type will be guided by the expected concentrations and the logistics of the measurement location(s). In general, there are more options for near-source sampling, measurements, and analysis because concentrations are typically higher closer to a known source. Field instruments with on-site analysis capabilities and sample collection devices paired with subsequent laboratory analyses may be available that can meet applicable method performance requirements; these are referenced in this presentation (USEPA 2022m). Given the current measurement technologies for ambient air, where EtO concentrations are expected to be low, laboratory analysis may be required instead of on-site field analysis.
Another item listed above to be considered is the duration of the sample collection. For source (e.g., stack) measurements, sample collection covering a batch process or an hour (if a continuous process) may be sufficient. For ambient or fence-line sampling, samples collected over a 24-hour period might be more appropriate so the data can be compared to national data sets. Although 24-hour durations are often used for ambient or fence-line sampling, collecting grab samples can also be useful to understand EtO concentrations from events that might occur over shorter time intervals. Meteorological data may be informative in ambient field study planning, such as determining sampling frequency and duration. For example, nearby airports or Automated Surface Observing Stations (ASOS) can be used to provide meteorological data, which is useful to identify potential influences on measured concentrations.
The predominant wind direction is another consideration that should be factored into decisions on sampling type and location. Using nearby wind data from local airports or ASOS stations, the annual primary and secondary wind directions can be determined. When sampling near a source, the sampling sites can be in the primary upwind, primary downwind, secondary upwind, and secondary downwind directions relative to the source of EtO. An example of a wind rose is shown below (Figure 19).
For further information on how to interpret and read wind roses, the reader can refer to this USEPA document (USEPA 2019c). Measurements that are paired with wind direction and speed from nearby meteorological stations will provide the end user with critical information about what might be contributing to the measured concentration. (Wind speed and direction are not applicable to in-stack sampling.)
As the sampling plan is being developed, the purpose of, or end use for, the data collection must be considered. The following question should be asked: Are these data being collected to provide fence-line information, characterize concentrations in a community, or provide ambient concentrations? The objectives for the data being collected will guide the specific sample locations, the number of samples needed, sampling frequency and duration, and quality control and assurance actions taken. If possible, routine comparisons among samples should be performed. This comparison could be in the form of collocated samples or samples at varying distances from the EtO source.
Determining the concentration from areas that are not influenced by sources of EtO (e.g., upwind) is also important to understand and interpret the data from the samples collected. The data should be representative of the area, and multiple samples should be considered to obtain a more complete understanding of the EtO concentration in areas in communities or near a source. Since EtO is challenging to measure at extremely low-level concentrations, a larger data set could provide higher-quality results because inconsistencies can be evaluated more meaningfully.
In order to consider other potential logistical concerns, the sampling program should plan for the following:
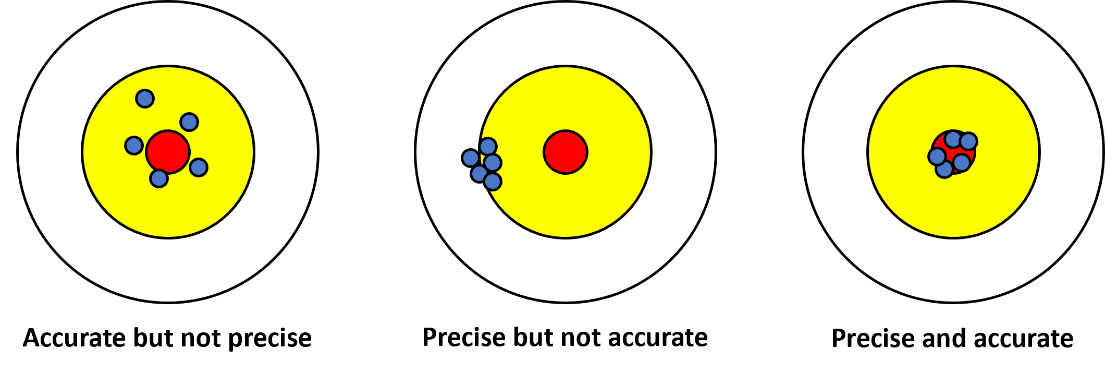
Figure 18. Illustration of accuracy and precision.
6.2.1 For ambient or fence-line monitoring consider the following questions:
- Is electricity available? This will determine what type of instrumentation or sampling technique is possible. Figure 20 shows an example of equipment that can be used without electricity.
- Sampling duration—will a short-term sample or a time-integrated sample be collected? Sampling over a 24-hour period from midnight to midnight will provide consistency with data available in USEPA’s Air Quality System (AQS), USEPA’s repository for collected and/or reported ambient air quality data. If, however, the 24-hour sampling period will cover a portion of two separate days, the sampling program should ensure consistency in the identification of the sampling day and associated meteorology evaluated during the sampling period.
- Can sampling be done around the facility in four quadrants near the facility fence line each sample day based on primary and secondary upwind and downwind directions? If so, the following steps can be taken when sampling:
- Locate the best practical sites to characterize emissions in the air in the communities near each facility (Figure 21 and Figure 22).
- Place sampler in a breathing zone that is best for the exposure scenario (e.g., the National Air Toxic Trends Station Technical Assistance Document (NATTS TAD) suggests 2–15 m from the ground surface) (USEPA 2022n).
- Place sampler with no obstructions in the monitoring pathway for most of the 360° area around the sample inlet.
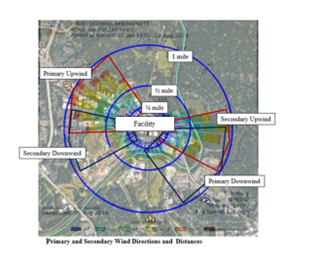
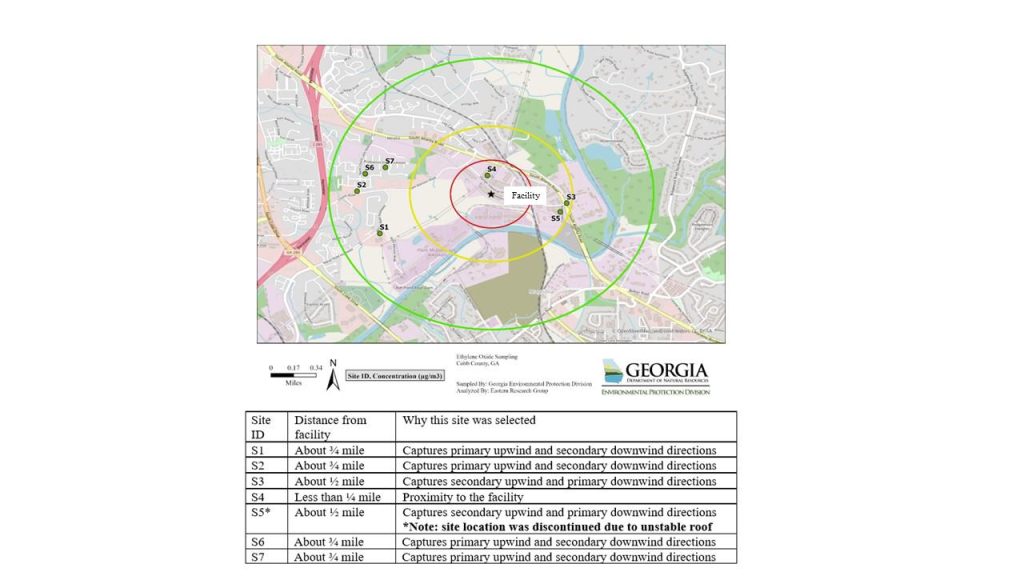
-
- Efforts should be made to ensure that air being sampled is not influenced by other nearby sources. Concurrent sampling at upwind locations or sites that are not located in the vicinity of any known EtO sources will provide comparison data for the samples being collected near a known source.
- If feasible, use dispersion modeling, such as AERMOD to choose sampling locations (USEPA 2023f).
- Whenever feasible, collocation (placement side by side) of identical samplers at each sampling site is helpful and allows precision determinations to be made (Figure 23). A target might be to have at least 10% of samples be collocated (USEPA 2022m).
- Field blanks should be used to assess contamination during transport to and from the laboratory. Also, care should be taken to ensure the canisters are capped and handled so that the valve-to-canister connection remains intact and is not compromised. The canister is shipped back to the laboratory for analysis without collecting a sample. This process of collecting a field blank provides confirmation that no contamination was introduced in the sampling setup process.
- Collection of samples at varying distances in the same wind direction should be considered to identify any spatial variations. These sample locations should be collected multiple times throughout the study (see the sites in Figure 24—both are in the same wind direction in relation to the facility).
When determining the sampling schedule, consideration of facility practices and operational hours is important. For instance, how often does the nearby facility change the process? Are emissions and operations consistent over all hours of the day and days of the week? Any sampling should be conducted under representative conditions. To ensure that ambient sampling is representative, a rotating sampling schedule as suggested by USEPA can be used (USEPA 2023ac). High humidity and large rainfall amounts may clog the sample inlet with water. This may result in reduced sample collection or loss of the sample entirely.
Another potential option to be explored for EtO analysis is sorbent tube sampling, which involves collecting a sample onto a sorbent tube or cartridge. Sorbent tubes are usually deployed near known sources of EtO for personnel monitoring in the workplace. As of the date of this guide, sorbent tube sampling for EtO has not been widely used for ambient measurements and are still being evaluated.
6.2.2 For source (in-stack) monitoring:
There is no “one size fits all” methodology or approach for in-stack EtO sampling; however, sampling for EtO can be conducted in a variety of ways. When sampling a source of EtO in stack to determine the quantity of emissions (Figure 25), working with state and local authorities is recommended, and the following questions should be considered:
- What type of stack is being tested (process exhaust, inlet/outlet of the control device, etc.)?
- What is the flow rate of the stack(s)?
- What control devices are present?
- Are other compounds present that will interfere with the EtO measurement?
- How will the moisture of the stack be accounted for in the measurement?
- What is the process operation?
- Is the sampling required by the permitting authority?
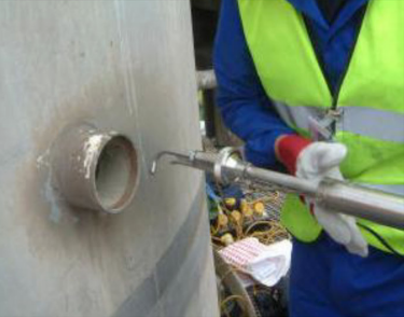
Continuous Emission Monitoring Systems (CEMS) involve the installation of monitoring equipment that accumulates data on a predetermined time schedule in a stack or duct. Performance (stack) testing involves the mobilization of monitoring equipment, often in a testing trailer, to accomplish data collection. Many of the principles of stack testing also apply to CEMS. The difference is that stack testing is performed for relatively short time periods (hours), while CEMS perform testing continuously or periodically over longer periods of time (months, years). Prior to performing a stack test, facilities will often be required to submit a plan of the intended procedures. An example test protocol format is provided courtesy of Michigan EGLE (MI EGLE 2019).
The performance (stack) test is often the method of determining compliance. The results of a stack test are significant to the regulatory agency and the source, and the results may determine the course of future enforcement discussions between them. Due to the complex nature of the various sampling methods, it is important that the test be performed in a valid and representative manner to assure each test is an accurate representation of a source’s actual emissions. A test plan or protocol is often required. An example format of this protocol is provided courtesy of Michigan EGLE.
Test plans or protocols will typically consist of the following:
- identification of the source to be tested and any associated equipment
- identification of the representative process operation(s)
- identification of the pollutants of interest and expected concentrations
- identification of the test methods to be used
- description of any other data to be collected during the testing
- references to applicable regulations or permit requirements
Performance testing is typically performed by an independent third-party testing firm, and it is not uncommon for the testing firm to prepare the test plan or protocol.
6.2.1 For ambient or fence-line monitoring consider the following questions:
- Is electricity available? This will determine what type of instrumentation or sampling technique is possible. Figure 20 shows an example of equipment that can be used without electricity.
- Sampling duration—will a short-term sample or a time-integrated sample be collected? Sampling over a 24-hour period from midnight to midnight will provide consistency with data available in USEPA’s Air Quality System (AQS), USEPA’s repository for collected and/or reported ambient air quality data. If, however, the 24-hour sampling period will cover a portion of two separate days, the sampling program should ensure consistency in the identification of the sampling day and associated meteorology evaluated during the sampling period.
- Can sampling be done around the facility in four quadrants near the facility fence line each sample day based on primary and secondary upwind and downwind directions? If so, the following steps can be taken when sampling:
- Locate the best practical sites to characterize emissions in the air in the communities near each facility (Figure 21 and Figure 22).
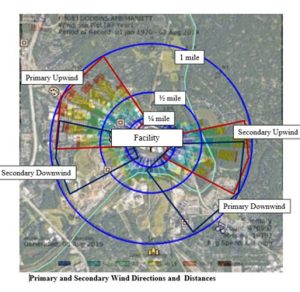
Figure 21. Example of determination of primary and secondary wind directions.
Source: Georgia Department of Natural Resources. Used with permission.
Figure 22. Example of sampling site located near a known EtO source.
Source: Georgia Department of Natural Resources. Used with permission. - Place sampler in a breathing zone that is best for the exposure scenario (e.g., the National Air Toxic Trends Station Technical Assistance Document (NATTS TAD) suggests 2–15 m from the ground surface) (USEPA 2022n).
- Place sampler with no obstructions in the monitoring pathway for most of the 360° area around the sample inlet.
- Efforts should be made to ensure that air being sampled is not influenced by other nearby sources. Concurrent sampling at upwind locations or sites that are not located in the vicinity of any known EtO sources will provide comparison data for the samples being collected near a known source.
- If feasible, use dispersion modeling, such as AERMOD to choose sampling locations (USEPA 2023f).
- Whenever feasible, collocation (placement side by side) of identical samplers at each sampling site is helpful and allows precision determinations to be made (Figure 23). A target might be to have at least 10% of samples be collocated (USEPA 2022m).
- Field blanks should be used to assess contamination during transport to and from the laboratory. Also, care should be taken to ensure the canisters are capped and handled so that the valve-to-canister connection remains intact and is not compromised. The canister is shipped back to the laboratory for analysis without collecting a sample. This process of collecting a field blank provides confirmation that no contamination was introduced in the sampling setup process.
- Collection of samples at varying distances in the same wind direction should be considered to identify any spatial variations. These sample locations should be collected multiple times throughout the study (see the sites in Figure 24—both are in the same wind direction in relation to the facility).
When determining the sampling schedule, consideration of facility practices and operational hours is important. For instance, how often does the nearby facility change the process? Are emissions and operations consistent over all hours of the day and days of the week? Any sampling should be conducted under representative conditions. To ensure that ambient sampling is representative, a rotating sampling schedule as suggested by USEPA can be used (USEPA 2023ac). High humidity and large rainfall amounts may clog the sample inlet with water. This may result in reduced sample collection or loss of the sample entirely.
Another potential option to be explored for EtO analysis is sorbent tube sampling, which involves collecting a sample onto a sorbent tube or cartridge. Sorbent tubes are usually deployed near known sources of EtO for personnel monitoring in the workplace. As of the date of this guide, sorbent tube sampling for EtO has not been widely used for ambient measurements and are still being evaluated.
6.2.2 For source (in-stack) monitoring:
There is no “one size fits all” methodology or approach for in-stack EtO sampling; however, sampling for EtO can be conducted in a variety of ways. When sampling a source of EtO in stack to determine the quantity of emissions (Figure 25), working with state and local authorities is recommended, and the following questions should be considered:
-
- What type of stack is being tested (process exhaust, inlet/outlet of the control device, etc.)?
-
- What is the flow rate of the stack(s)?
-
- What control devices are present?
-
- Are other compounds present that will interfere with the EtO measurement?
-
- How will the moisture of the stack be accounted for in the measurement?
-
- What is the process operation?
-
- Is the sampling required by the permitting authority?
Continuous Emission Monitoring Systems (CEMS) involve the installation of monitoring equipment that accumulates data on a predetermined time schedule in a stack or duct. Performance (stack) testing involves the mobilization of monitoring equipment, often in a testing trailer, to accomplish data collection. Many of the principles of stack testing also apply to CEMS. The difference is that stack testing is performed for relatively short time periods (hours), while CEMS perform testing continuously or periodically over longer periods of time (months, years). Prior to performing a stack test, facilities will often be required to submit a plan of the intended procedures. An example test protocol format is provided courtesy of Michigan EGLE (MI EGLE 2019).
The performance (stack) test is often the method of determining compliance. The results of a stack test are significant to the regulatory agency and the source, and the results may determine the course of future enforcement discussions between them. Due to the complex nature of the various sampling methods, it is important that the test be performed in a valid and representative manner to assure each test is an accurate representation of a source’s actual emissions. A test plan or protocol is often required. An example format of this protocol is provided courtesy of Michigan EGLE.
Test plans or protocols will typically consist of the following:
-
- identification of the source to be tested and any associated equipment
-
- identification of the representative process operation(s)
-
- identification of the pollutants of interest and expected concentrations
-
- identification of the test methods to be used
-
- description of any other data to be collected during the testing
-
- references to applicable regulations or permit requirements
Performance testing is typically performed by an independent third-party testing firm, and it is not uncommon for the testing firm to prepare the test plan or protocol.
- Locate the best practical sites to characterize emissions in the air in the communities near each facility (Figure 21 and Figure 22).
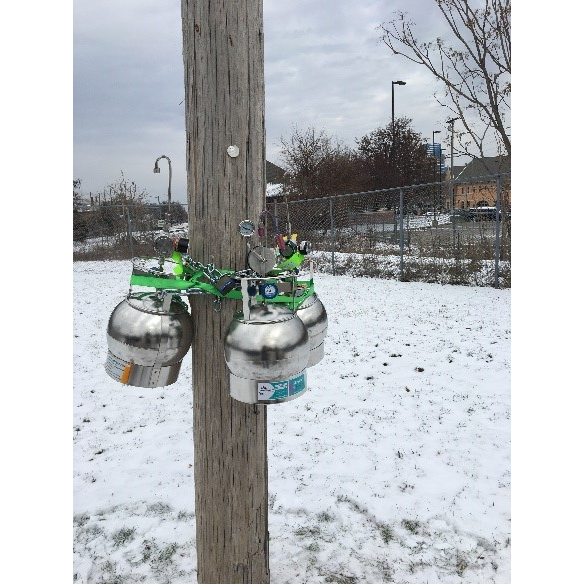
Figure 20. Example of EtO ambient sampling set up.
Source: Michigan Department of Environment, Great Lakes, and Energy. Used with permission.

Figure 21. Example of determination of primary and secondary wind directions.
Source: Georgia Department of Natural Resources. Used with permission.
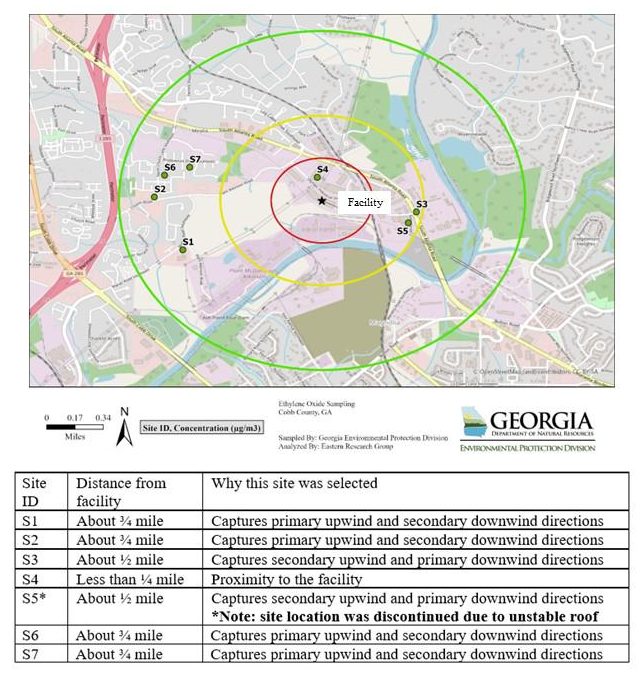
Figure 22. Example of sampling site located near a known EtO source.
Source: Georgia Department of Natural Resources. Used with permission.
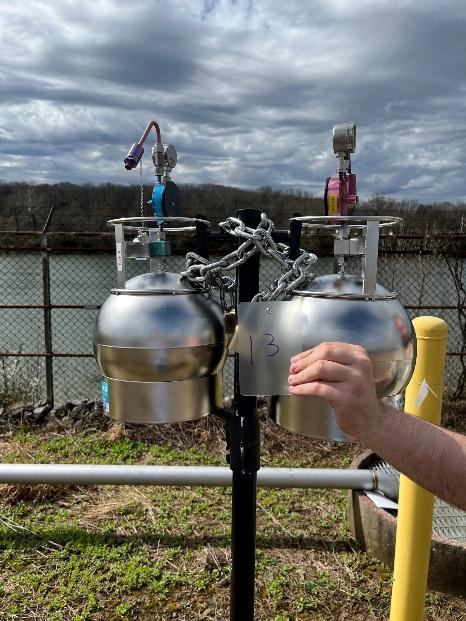
Figure 23. Collocated samples.
Source: Mike Egnor / West Virginia Department of Environmental Protection. Used with permission.
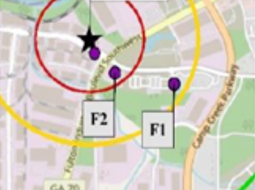
Figure 24. Example of spatial samples.
The star represents the EtO source. F1 and F2 are stationary sampling locations in the same wind direction. Red and yellow rings represent two predetermined distances from the EtO source.
Source: Georgia Department of Natural Resources. Used with permission.
6.3 Field Sampling and Measurements (Including Sampling Strategies)
6.3.1 Continuous Emissions Monitoring Systems (CEMS) and Performance/Stack Testing
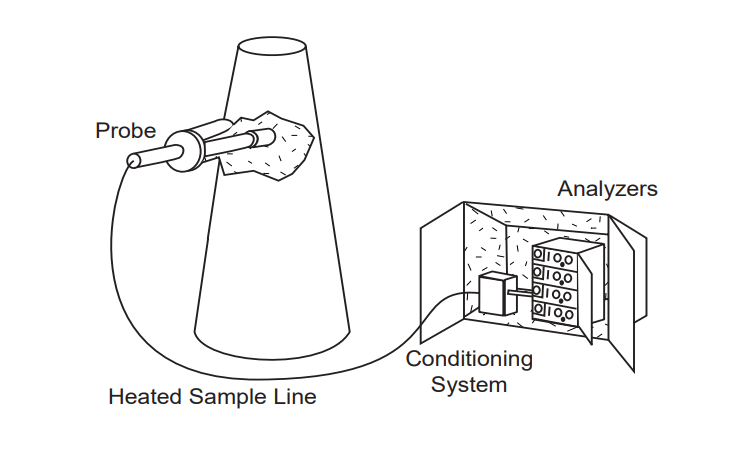
Figure 26. Example of an extractive CEMS with cool-dry sample.
Source: USEPA (2000).
A CEMS is installed in a stack to provide real-time or near real-time measurements of EtO concentrations emitted from a process, typically for the purpose of regulatory compliance (Figure 26). In the case of sampling, preconcentration or time-averaged measurements are used.
Continuous emissions monitoring for EtO can typically be accomplished with FTIR instrumentation using USEPA Method 320 (see Section 3.4 for updated information on regulations). Enhancements using bandpath filters and improved electronics can lower the limit of detection for EtO if required. New methods such as CRDS and mid-infrared spectroscopy are potential future candidates.
Performance (stack) testing is periodic testing performed specifically to determine regulatory compliance or emission rates. This testing can be performed separately from the CEMS and/or performed to compare against the CEMS. Additionally, performance (stack) testing can be conducted by sampling as described above, with analysis by USEPA Method TO-15, TO-15A, and 18. Sampling can also be conducted using FTIR via USEPA Method 320, although USEPA approval is required at this time. The use of alternate test methodologies requires federal approval.
When evaluating a performance (stack) test plan, the following factors should be considered:
- Are the sampling locations indoors or outdoors? If outdoors, is weather a concern for safety when accessing or sampling?
- How is the sampling location accessed by personnel?
- How is the equipment accessed, if applicable?
- What is the source type being tested?
- For an EtO vent/exhaust, is a scrubber present? If so, how will moisture be accounted for?
- For a process vent are there any other pollutants that would interfere with the sample analysis?
6.4 Best Practices and Challenges for an EtO Sampling Program
Analytical challenges include the following:
- For the method being used to sample EtO, is the method sensitive to interferences such as moisture or other pollutants being emitted?
- Is the sampling equipment sufficient to ensure that line loss is minimized?
- Is there any occurrence of EtO formation in the canisters?
- Is the operation of any EtO measurement with associated field analysis performed by a qualified individual? Some of the methods with on-site analysis require trained personnel for interpretation of the data collected.
Regulatory challenges include the following:
- Is test method approval necessary for the regulation being tested for?
- Is federal approval needed for any requested modifications to the test method?
- Background interference – for the purposes of this guide, background EtO is defined as EtO in ambient air that is not clearly linked to any known or suspected source, such as a chemical plant or commercial sterilizer.
Current techniques for sampling EtO (with field or laboratory analyses) have associated challenges. For each of the methods described in this section, the quality of the gas standards used to calibrate the analytical equipment (both in the laboratory and in the field) should be considered. Higher concentrations of EtO that may be used for in-stack/source sampling have been found to be stable for several years. As the concentration of EtO calibration gas in the cylinder decreases, the stability of standards in the cylinder can become a potential issue (Figure 27). Very low concentrations (sub-ppb) of EtO in cylinder gases were found to degrade within a short time. See the 2022 USEPA presentation on the status of EtO source measurements for additional information (USEPA 2022m).
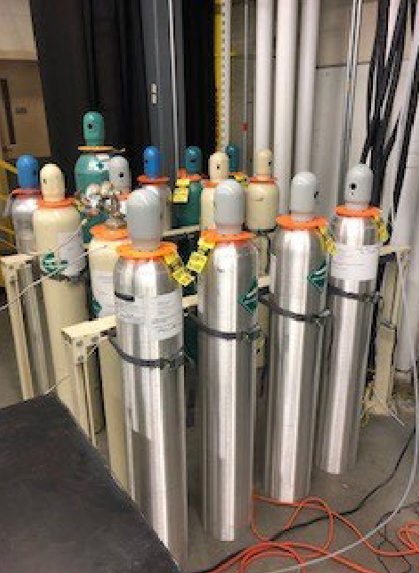
Sampling analysis using USEPA Method TO-15 or TO-15A is challenging when measuring trace concentration levels (i.e., those close to the method detection limits). As stated by USEPA in a technical note, EtO measurement using Method TO-15 or Method TO-15A at very low levels results in a greater uncertainty and lower accuracy than at higher levels (USEPA 2021f). Improvements to this methodology are the subject of ongoing research efforts. For more general information on Method TO-15 and Method TO-15A, refer to the USEPA Ambient Monitoring Technical Information Center website (USEPA 1999).
Some best practices for the different sampling methodologies are discussed below.
Sampling without electricity requires a high-purity flow regulation system used to fill canisters at a constant rate with sufficient vacuum (Figure 28). These sampling units typically consist of three main parts—the vacuum regulator, the flow restrictor, and the inlet. The vacuum regulator houses a diaphragm and a control nozzle that allows the pressure to be maintained just below atmospheric pressure even as the pressure in the attached canister increases. By choosing the appropriate restrictor, based on the canister size and sampling duration required, the flow rate will remain constant. With some restrictors, the flow rate can be adjusted by a factor of three by adjusting the position of the control nozzle (refer to manufacturer specifications).
Pressurized (or active) sampling involves collection of samples above atmospheric pressure using a pump and flow control to push air into the canister (which requires electricity). One advantage of pressurized sample collection is that if the canister leaks slightly, the sample will not become contaminated if the canister pressure remains greater than atmospheric pressure. Another advantage is the increased amount of sample, which allows for multiple analyses of the same sample. Multiple analyses of the same sample depend on laboratory capability.
Certain procedures need to be followed to avoid contamination when using Method TO-15 or Method TO-15A laboratory analyses. One step among many in preventing contamination is not opening the canister in the laboratory prior to analysis. Post-sampling subambient canisters should have pressures that follow manufacturer guidelines. The data quality may be called into question when the pressure in the canister approaches 0 inHg. Post-sampling pressurized (active) canisters should also follow manufacturer guidelines to have sufficient pressure at the completion of sampling. Pressurized canisters typically have a positive pressure no greater than 3 pounds per square inch of pressure (psig) to reduce the likelihood of condensation inside the canister (USEPA 2022o). Care must be taken when the canisters are under vacuum and stored in the laboratory. If there is a slight leak in the canister cap or valve, then laboratory air can enter the canister and affect the sample. For more information on passive samplers, see Section 6.5.2.
As a best practice, and before being used in the field, the subambient and active samplers and associated timers can be used to collect zero-air samples to be analyzed at an analytical support laboratory. This practice ensures that the samplers do not have any contamination. The initial canister vacuum is verified prior to sample collection by measuring the canister vacuum with a pressure gauge. This initial reading should be documented on the sample collection form and/or chain of custody. Canisters should show ≥ 28 inHg prior to sampling.
Performance/stack sampling will require sufficient flow for each system and that the process operations are conducted representatively. Water (moisture) can cause interferences with many of the sampling approaches (both with laboratory and field analyses). Moisture from the sample should be removed without impacting the EtO concentration (such as the use of heated lines if required by the sampling method). For these systems, the calibration of the instrumentation occurs in the field as a measure of the instrument performance and for quantification of the EtO concentrations present. Often, a data acquisition system will be used to capture the EtO concentration during the sampling period and will usually provide measurements on a small interval (such as every 10 minutes or less).
Safety may also be a challenge when measuring inlet concentrations to control equipment due to the placement of a sample probe in the gas stream that may contain high concentrations of EtO.
6.5 Canister Sampling Challenges and Common Errors
6.5.1 Canister Bias (Affects Both Pressurized and Subambient Canisters)
Some samples may continue to have reactions after sample collection in the canister; this causes EtO to become more abundant in concentration and is known as the canister effect. This is a positive sampling bias that can potentially be introduced by certain canisters. For more information, see the USEPA memos dated May 7, 2021 (USEPA 2021c), and May 25, 2021 (USEPA 2021i). Although this canister effect is more prevalent in certain canister types and interior coatings or linings, it may not impact every can of that type or with that coating. Canisters with a silicon-ceramic-lined inner surface appear to be less affected by the EtO canister bias than those with an electropolished inner surface for the typical laboratory sample holding times (~30 days).
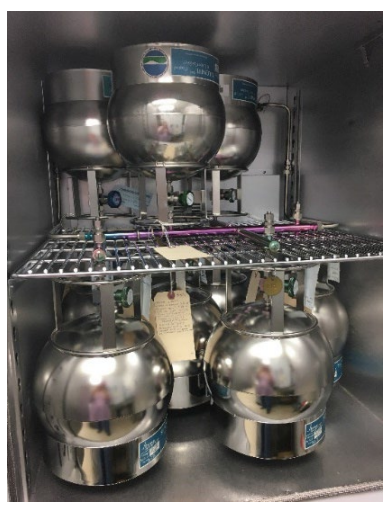
The EtO data in AQS reported by Eastern Research Group (ERG), USEPA’s national contract laboratory, were qualified to reflect current method issues of canister bias effect and coelutions. Any affected data were qualified with the LK flag (analyte identified; reported value may be biased high) or LJ flag (identification of analyte is acceptable; reported value is an estimate). Public access to the AQS is available at this link (USEPA 2023c).
Method TO-15 and/or Method TO-15A allow flexibility in canister cleaning methods, which may result in canisters with varying levels of cleanliness; the canister manufacturer’s guidance on cleaning their particular type of canisters should be followed. Figure 29 provides an example of a laboratory canister cleaning configuration. For example, both humidified inert nitrogen and humified zero air are allowed to be used as the diluent gas for canister cleaning methods. TO-15A notes that canister qualification zero-air challenges are performed by pressurizing clean evacuated canisters with humidified (40% to 50% relative humidity) zero air. Performing this qualification with nitrogen does not adequately test the canister because inert nitrogen does not permit reactions within the canister that may occur when ambient air is sampled. Each canister should be allowed to equilibrate for a minimum of 24 hours prior to analysis.
6.5.2 Passive Samplers
Passive samplers (e.g., flow regulator and, if applicable, associated timer) do not require electricity; the sampler and associated timer present unique challenges as compared to other sampling techniques. The batteries for the timer do not last very long when the temperature is below freezing because this equipment is not climate controlled. This may cause the timer solenoid valve to fail to actuate if batteries are not fully or close to fully charged. At low or freezing temperatures, timer solenoid valves may not actuate and remain in “open” position at the end of sampling, leading to full evacuation of the canister. Temperature swings during the day, especially at the change of the season in the spring and/or fall, present challenges in obtaining the desired end pressure. The flow regulators are calibrated for a specific temperature range, and the large swings in temperatures at the change of season may impact the amount of sample collected. In addition, USEPA does not recommend the use of stand-alone timers and stated in a technical memorandum dated February 2021 that 0 inHg upon recovery should result in an invalid sample (USEPA 2021j).
6.5.3 Pressurized Sampling Challenges
Ambient air samples collected in canisters above atmospheric pressure may exhibit condensation on the interior canister surfaces (McClenny, Schmidt, and Kronmiller 1999). Water or moisture inside the canister can cause a variety of issues for analysis. For example, when the pressure decreases, the equilibrium of analytes between the liquid and gas phases changes. Additionally, when replicate samples from the same canister are analyzed, the amount of condensation decreases as air is removed with each sample analysis. Therefore, replicate samples would not agree. In order to avoid any number of complications due to water or moisture, monitoring agencies collecting pressurized samples should not pressurize canisters above 3 psig to minimize the condensation of liquid water inside the canister (McClenny, Schmidt, and Kronmiller 1999).
6.5.4 Analytical Challenges
As of the publication of this guide, analytical laboratories were not reporting method detection limits or sensitivity at or below USEPA IRIS risk level of 0.02 µg/m3 (approximately 11 ppt or 0.011 ppb). Performance-based methods are used to measure EtO. Due to the flexibility in the way these methods are applied by laboratories, measurement results can vary, leading to differences in EtO concentrations being reported. Performance-based methods are typically applied differently from laboratory to laboratory, which may result in variability among reported concentrations and the related uncertainty. Calibration standards, handling, preparation and cleaning methods, maintenance practice and requirements, and equipment conditions are all examples of differences that may influence results. When ambient EtO levels are measured near the method detection limit, uncertainty in measurements increases. Work is ongoing to improve measurement methods, which may lower measurement uncertainty (Figure 30).
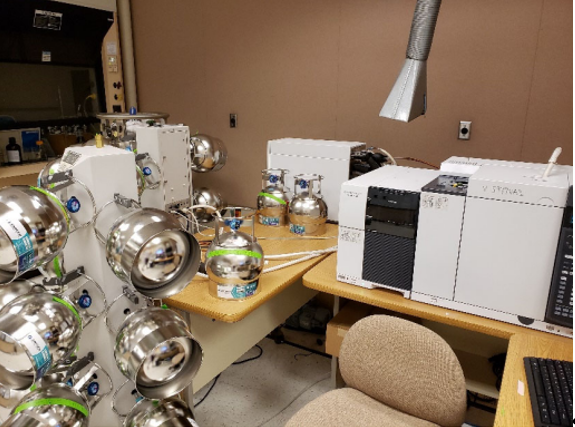
Another example of performance-based flexibility in Method TO-15 and Method TO-15A is that the target ion mass to charge ratio (m/z) in the analytical chromatogram selected to quantify EtO is not standardized across analytical laboratories (i.e., some laboratories use the 29 m/z ion rather than the 44 m/z ion to quantify EtO). The USEPA technical webinar on EtO measurements from April 2021 provides information on each of these two ions that can be used to quantify EtO (USEPA 2021g). When the resulting analytical chromatogram of the sample is reviewed, coelution of two or more compounds in the samples may have occurred. Therefore, laboratories use a variety of columns (i.e., a slightly polar analytical column) to improve the separation of EtO from the interfering compound. At the very low levels of EtO being measured in some areas, meeting the precision targets of the methodology is very challenging. Other compounds present in the air when the sample is collected may cause challenges to sample analysis by interfering with EtO during analysis. Given the flexibility of the performance-based nature of Method TO-15 and Method TO-15A, measurements made are laboratory dependent. USEPA is working toward developing Method TO-15A guidance aimed at helping to improve consistency in results across laboratories.
6.6 Data Interpretation: What do the Numbers Mean?
Understanding the timing and purpose of sample collection is critical when interpreting data. For stack sampling, continuous monitoring or sampling over a production cycle (on a time scale of hours to days) may be sufficient to characterize emissions and understand, for example, whether emission control equipment is operating properly. For chronic risk assessments, modeling is used with a typical time scale for evaluation over a lifetime of 70 years with the assumption that exposure occurs 24 hours per day. Thus, it becomes clear that a single grab air sample or even small groups of samples collected over 24 hours represent limited spatial and temporal snapshots and should not be used, in isolation, for understanding risk or decision-making. A small group of samples may be used to inform the decision to set up a longer-term monitoring site.
Historically, EtO has not been included in the suite of analytes measured as part of the NATTS program or reported as a target analyte by USEPA Method TO-15 or TO-15A, the most common laboratory analytical methods used to measure VOCs in air. Recent revisions to the NATTS program guidance in the TAD Revision 4 include guidance for EtO sampling, measurement, and analysis. Limited EtO data and relatively few studies exist on the presence or concentration of EtO in the environment. There is no current consensus on what constitutes background concentrations because of the challenges noted above. There has been a growing focus on this chemical since USEPA’s 2016 IRIS assessment updated the cancer potency of EtO. Several states have conducted sampling programs to better understand EtO concentrations in ambient air. These states include but are not limited to Colorado, Georgia, Illinois, Michigan, South Carolina, Utah, and West Virginia.
Typically, concentrations of EtO are greater when measurements are made closer to a source; however, given challenges with environmental sampling and laboratory analysis, EtO measurement results could vary widely. The end user should evaluate the concentrations measured and compare them to other available information. Measurements made near or at the detection limit, or threshold of sensitivity, of any instrumental analysis are associated with higher levels of measurement uncertainty. Any sampling data set should also be evaluated for quality indicators or qualifier flags associated with the data as indicated by the analytical laboratory quality control documents. A qualifier flag does not always invalidate the result but provides the data user with important information that may affect use of the result. Canister bias or instances of coelution of compounds (when compounds overlap in the chromatogram when analyzed by gas chromatography–mass spectrometry) is often qualified with an LK (analyte identified; reported value may be biased high) or LJ (identification of analyte is acceptable; reported value is an estimate) flag from the analytical laboratory. Other quality indicators can be found in the USEPA AQS Qualifier Code list (USEPA 2023k). As of the date of publication of this guide, uncertainty in EtO measurements is a concern, especially in sampling areas that appear unassociated with known EtO sources. Uncertainty in EtO measurements needs consideration in data interpretation, and reducing uncertainty in EtO measurement is a continued focus of research and development.
Table 3 summarizes EtO concentration ranges reported to AQS for the calendar year 2021. Per USEPA, “the Air Quality System (AQS) contains ambient air pollution data collected by USEPA, state, local, and tribal air pollution control agencies from over thousands of monitors” (USEPA 2023b).
Table 3. Summary of EtO concentrations from USEPA’s Air Quality System
Notes: ppb = parts per billion.
A canister bias issue was communicated in 2021 through a national webinar on TO-15/TO-15A in April of 2021 (USEPA 2021h). In addition, most of the NATTS were reporting EtO data by the first quarter of 2021. The EtO data from AQS is represented by each USEPA region, which includes all the concentrations available in AQS as well as those with the qualifiers LK and LJ. When a value is not detected by the laboratory, a code of nondetect is reported in AQS, and the system assigns a value of zero. When a concentration is detected below the method detection limit, the results are valid, and substituting values such as ½ the method detection limit or zero is not permitted (USEPA 2022o). Table 3 is not intended to be comprehensive; rather, it is meant to provide context for interpreting data. In other words, what is “normal” in each USEPA region given the canister and other bias issues is noted above in the challenges. Further technical guidance is needed for improved consistency in EtO measurements. USEPA is currently working on developing this guidance.
Having confidence in, or understanding the limitations of, sample results is also critical. Because of this, data validation is confirmed before data interpretation or use. This is an important step for all environmental measurements; however, EtO introduces unique issues that can complicate data interpretation, as discussed above. These complications include but are not limited to, the following:
- Stability of calibration standards—concern of EtO degradation in calibration gas cylinders (USEPA 2019d)
- Canister bias and compound/matrix coelutions and interferences that may affect concentrations—concern that electropolished canisters may not be suitable for EtO ambient monitoring, and that silicon-ceramic-lined canisters should be used instead (USEPA 2021c)
- Canister effect—concern that EtO may form inside certain canisters, resulting in a positive bias (USEPA 2021i)
- Data set size and sample location (e.g., rural, urban) should be taken into consideration before comparing values.
Research to overcome these issues is ongoing, and better methodologies to quantify EtO are forthcoming. In the meantime, it is recommended that data validation be conducted and potential biases be accounted for in decision-making (e.g., resample in the event of anomalous results).
6.4 Best Practices and Challenges for an EtO Sampling Program
Analytical challenges include the following:
-
- For the method being used to sample EtO, is the method sensitive to interferences such as moisture or other pollutants being emitted?
-
- Is the sampling equipment sufficient to ensure that line loss is minimized?
-
- Is there any occurrence of EtO formation in the canisters?
-
- Is the operation of any EtO measurement with associated field analysis performed by a qualified individual? Some of the methods with on-site analysis require trained personnel for interpretation of the data collected.
Regulatory challenges include the following:
-
- Is test method approval necessary for the regulation being tested for?
-
- Is federal approval needed for any requested modifications to the test method?
-
- Background interference – for the purposes of this guide, background EtO is defined as EtO in ambient air that is not clearly linked to any known or suspected source, such as a chemical plant or commercial sterilizer.
Current techniques for sampling EtO (with field or laboratory analyses) have associated challenges. For each of the methods described in this section, the quality of the gas standards used to calibrate the analytical equipment (both in the laboratory and in the field) should be considered. Higher concentrations of EtO that may be used for in-stack/source sampling have been found to be stable for several years. As the concentration of EtO calibration gas in the cylinder decreases, the stability of standards in the cylinder can become a potential issue (Figure 27). Very low concentrations (sub-ppb) of EtO in cylinder gases were found to degrade within a short time. See the 2022 USEPA presentation on the status of EtO source measurements for additional information (USEPA 2022m).
Sampling analysis using USEPA Method TO-15 or TO-15A is challenging when measuring trace concentration levels (i.e., those close to the method detection limits). As stated by USEPA in a technical note, EtO measurement using Method TO-15 or Method TO-15A at very low levels results in a greater uncertainty and lower accuracy than at higher levels (USEPA 2021f). Improvements to this methodology are the subject of ongoing research efforts. For more general information on Method TO-15 and Method TO-15A, refer to the USEPA Ambient Monitoring Technical Information Center website (USEPA 1999).
Some best practices for the different sampling methodologies are discussed below.
Sampling without electricity requires a high-purity flow regulation system used to fill canisters at a constant rate with sufficient vacuum (Figure 28). These sampling units typically consist of three main parts—the vacuum regulator, the flow restrictor, and the inlet. The vacuum regulator houses a diaphragm and a control nozzle that allows the pressure to be maintained just below atmospheric pressure even as the pressure in the attached canister increases. By choosing the appropriate restrictor, based on the canister size and sampling duration required, the flow rate will remain constant. With some restrictors, the flow rate can be adjusted by a factor of three by adjusting the position of the control nozzle (refer to manufacturer specifications).
Pressurized (or active) sampling involves collection of samples above atmospheric pressure using a pump and flow control to push air into the canister (which requires electricity). One advantage of pressurized sample collection is that if the canister leaks slightly, the sample will not become contaminated if the canister pressure remains greater than atmospheric pressure. Another advantage is the increased amount of sample, which allows for multiple analyses of the same sample. Multiple analyses of the same sample depend on laboratory capability.
Certain procedures need to be followed to avoid contamination when using Method TO-15 or Method TO-15A laboratory analyses. One step among many in preventing contamination is not opening the canister in the laboratory prior to analysis. Post-sampling subambient canisters should have pressures that follow manufacturer guidelines. The data quality may be called into question when the pressure in the canister approaches 0 inHg. Post-sampling pressurized (active) canisters should also follow manufacturer guidelines to have sufficient pressure at the completion of sampling. Pressurized canisters typically have a positive pressure no greater than 3 pounds per square inch of pressure (psig) to reduce the likelihood of condensation inside the canister (USEPA 2022o). Care must be taken when the canisters are under vacuum and stored in the laboratory. If there is a slight leak in the canister cap or valve, then laboratory air can enter the canister and affect the sample. For more information on passive samplers, see Section 6.5.2.
As a best practice, and before being used in the field, the subambient and active samplers and associated timers can be used to collect zero-air samples to be analyzed at an analytical support laboratory. This practice ensures that the samplers do not have any contamination. The initial canister vacuum is verified prior to sample collection by measuring the canister vacuum with a pressure gauge. This initial reading should be documented on the sample collection form and/or chain of custody. Canisters should show ≥ 28 inHg prior to sampling.
Performance/stack sampling will require sufficient flow for each system and that the process operations are conducted representatively. Water (moisture) can cause interferences with many of the sampling approaches (both with laboratory and field analyses). Moisture from the sample should be removed without impacting the EtO concentration (such as the use of heated lines if required by the sampling method). For these systems, the calibration of the instrumentation occurs in the field as a measure of the instrument performance and for quantification of the EtO concentrations present. Often, a data acquisition system will be used to capture the EtO concentration during the sampling period and will usually provide measurements on a small interval (such as every 10 minutes or less).
Safety may also be a challenge when measuring inlet concentrations to control equipment due to the placement of a sample probe in the gas stream that may contain high concentrations of EtO.
6.5 Canister Sampling Challenges and Common Errors
6.5.1 Canister Bias (Affects Both Pressurized and Subambient Canisters)
Some samples may continue to have reactions after sample collection in the canister; this causes EtO to become more abundant in concentration and is known as the canister effect. This is a positive sampling bias that can potentially be introduced by certain canisters. For more information, see the USEPA memos dated May 7, 2021 (USEPA 2021c), and May 25, 2021 (USEPA 2021i). Although this canister effect is more prevalent in certain canister types and interior coatings or linings, it may not impact every can of that type or with that coating. Canisters with a silicon-ceramic-lined inner surface appear to be less affected by the EtO canister bias than those with an electropolished inner surface for the typical laboratory sample holding times (~30 days).
The EtO data in AQS reported by Eastern Research Group (ERG), USEPA’s national contract laboratory, were qualified to reflect current method issues of canister bias effect and coelutions. Any affected data were qualified with the LK flag (analyte identified; reported value may be biased high) or LJ flag (identification of analyte is acceptable; reported value is an estimate). Public access to the AQS is available at this link (USEPA 2023c).
Method TO-15 and/or Method TO-15A allow flexibility in canister cleaning methods, which may result in canisters with varying levels of cleanliness; the canister manufacturer’s guidance on cleaning their particular type of canisters should be followed. Figure 29 provides an example of a laboratory canister cleaning configuration. For example, both humidified inert nitrogen and humified zero air are allowed to be used as the diluent gas for canister cleaning methods. TO-15A notes that canister qualification zero-air challenges are performed by pressurizing clean evacuated canisters with humidified (40% to 50% relative humidity) zero air. Performing this qualification with nitrogen does not adequately test the canister because inert nitrogen does not permit reactions within the canister that may occur when ambient air is sampled. Each canister should be allowed to equilibrate for a minimum of 24 hours prior to analysis.
6.5.2 Passive Samplers
Passive samplers (e.g., flow regulator and, if applicable, associated timer) do not require electricity; the sampler and associated timer present unique challenges as compared to other sampling techniques. The batteries for the timer do not last very long when the temperature is below freezing because this equipment is not climate controlled. This may cause the timer solenoid valve to fail to actuate if batteries are not fully or close to fully charged. At low or freezing temperatures, timer solenoid valves may not actuate and remain in “open” position at the end of sampling, leading to full evacuation of the canister. Temperature swings during the day, especially at the change of the season in the spring and/or fall, present challenges in obtaining the desired end pressure. The flow regulators are calibrated for a specific temperature range, and the large swings in temperatures at the change of season may impact the amount of sample collected. In addition, USEPA does not recommend the use of stand-alone timers and stated in a technical memorandum dated February 2021 that 0 inHg upon recovery should result in an invalid sample (USEPA 2021j).
6.5.3 Pressurized Sampling Challenges
Ambient air samples collected in canisters above atmospheric pressure may exhibit condensation on the interior canister surfaces (McClenny, Schmidt, and Kronmiller 1999). Water or moisture inside the canister can cause a variety of issues for analysis. For example, when the pressure decreases, the equilibrium of analytes between the liquid and gas phases changes. Additionally, when replicate samples from the same canister are analyzed, the amount of condensation decreases as air is removed with each sample analysis. Therefore, replicate samples would not agree. In order to avoid any number of complications due to water or moisture, monitoring agencies collecting pressurized samples should not pressurize canisters above 3 psig to minimize the condensation of liquid water inside the canister (McClenny, Schmidt, and Kronmiller 1999).
6.5.4 Analytical Challenges
As of the publication of this guide, analytical laboratories were not reporting method detection limits or sensitivity at or below USEPA IRIS risk level of 0.02 µg/m3 (approximately 11 ppt or 0.011 ppb). Performance-based methods are used to measure EtO. Due to the flexibility in the way these methods are applied by laboratories, measurement results can vary, leading to differences in EtO concentrations being reported. Performance-based methods are typically applied differently from laboratory to laboratory, which may result in variability among reported concentrations and the related uncertainty. Calibration standards, handling, preparation and cleaning methods, maintenance practice and requirements, and equipment conditions are all examples of differences that may influence results. When ambient EtO levels are measured near the method detection limit, uncertainty in measurements increases. Work is ongoing to improve measurement methods, which may lower measurement uncertainty (Figure 30).
Another example of performance-based flexibility in Method TO-15 and Method TO-15A is that the target ion mass to charge ratio (m/z) in the analytical chromatogram selected to quantify EtO is not standardized across analytical laboratories (i.e., some laboratories use the 29 m/z ion rather than the 44 m/z ion to quantify EtO). The USEPA technical webinar on EtO measurements from April 2021 provides information on each of these two ions that can be used to quantify EtO (USEPA 2021g). When the resulting analytical chromatogram of the sample is reviewed, coelution of two or more compounds in the samples may have occurred. Therefore, laboratories use a variety of columns (i.e., a slightly polar analytical column) to improve the separation of EtO from the interfering compound. At the very low levels of EtO being measured in some areas, meeting the precision targets of the methodology is very challenging. Other compounds present in the air when the sample is collected may cause challenges to sample analysis by interfering with EtO during analysis. Given the flexibility of the performance-based nature of Method TO-15 and Method TO-15A, measurements made are laboratory dependent. USEPA is working toward developing Method TO-15A guidance aimed at helping to improve consistency in results across laboratories.
6.6 Data Interpretation: What do the Numbers Mean?
Understanding the timing and purpose of sample collection is critical when interpreting data. For stack sampling, continuous monitoring or sampling over a production cycle (on a time scale of hours to days) may be sufficient to characterize emissions and understand, for example, whether emission control equipment is operating properly. For chronic risk assessments, modeling is used with a typical time scale for evaluation over a lifetime of 70 years with the assumption that exposure occurs 24 hours per day. Thus, it becomes clear that a single grab air sample or even small groups of samples collected over 24 hours represent limited spatial and temporal snapshots and should not be used, in isolation, for understanding risk or decision-making. A small group of samples may be used to inform the decision to set up a longer-term monitoring site.
Historically, EtO has not been included in the suite of analytes measured as part of the NATTS program or reported as a target analyte by USEPA Method TO-15 or TO-15A, the most common laboratory analytical methods used to measure VOCs in air. Recent revisions to the NATTS program guidance in the TAD Revision 4 include guidance for EtO sampling, measurement, and analysis. Limited EtO data and relatively few studies exist on the presence or concentration of EtO in the environment. There is no current consensus on what constitutes background concentrations because of the challenges noted above. There has been a growing focus on this chemical since USEPA’s 2016 IRIS assessment updated the cancer potency of EtO. Several states have conducted sampling programs to better understand EtO concentrations in ambient air. These states include but are not limited to Colorado, Georgia, Illinois, Michigan, South Carolina, Utah, and West Virginia.
Typically, concentrations of EtO are greater when measurements are made closer to a source; however, given challenges with environmental sampling and laboratory analysis, EtO measurement results could vary widely. The end user should evaluate the concentrations measured and compare them to other available information. Measurements made near or at the detection limit, or threshold of sensitivity, of any instrumental analysis are associated with higher levels of measurement uncertainty. Any sampling data set should also be evaluated for quality indicators or qualifier flags associated with the data as indicated by the analytical laboratory quality control documents. A qualifier flag does not always invalidate the result but provides the data user with important information that may affect use of the result. Canister bias or instances of coelution of compounds (when compounds overlap in the chromatogram when analyzed by gas chromatography–mass spectrometry) is often qualified with an LK (analyte identified; reported value may be biased high) or LJ (identification of analyte is acceptable; reported value is an estimate) flag from the analytical laboratory. Other quality indicators can be found in the USEPA AQS Qualifier Code list (USEPA 2023k). As of the date of publication of this guide, uncertainty in EtO measurements is a concern, especially in sampling areas that appear unassociated with known EtO sources. Uncertainty in EtO measurements needs consideration in data interpretation, and reducing uncertainty in EtO measurement is a continued focus of research and development.
Table 3 summarizes EtO concentration ranges reported to AQS for the calendar year 2021. Per USEPA, “the Air Quality System (AQS) contains ambient air pollution data collected by USEPA, state, local, and tribal air pollution control agencies from over thousands of monitors” (USEPA 2023b).
Table 3. Summary of EtO concentrations from USEPA’s Air Quality System
| Region | Number of Observations | Mean, ppb | 90th Percentile, ppb |
| 1 | 591 | 0.10 | 0.14 |
| 2 | 968 | 0.08 | 0.16 |
| 3 | 55 | 0.15 | 0.32 |
| 4 | 631 | 0.10 | 0.21 |
| 5 | 411 | 0.08 | 0.18 |
| 6 | 61 | 0.21 | 0.36 |
| 7 | 54 | 0.12 | 0.28 |
| 8 | 98 | 0.10 | 0.24 |
| 9 | 208 | 0.12 | 0.28 |
| 10 | 174 | 0.11 | 0.20 |
Notes: ppb = parts per billion.
A canister bias issue was communicated in 2021 through a national webinar on TO-15/TO-15A in April of 2021 (USEPA 2021h). In addition, most of the NATTS were reporting EtO data by the first quarter of 2021. The EtO data from AQS is represented by each USEPA region, which includes all the concentrations available in AQS as well as those with the qualifiers LK and LJ. When a value is not detected by the laboratory, a code of nondetect is reported in AQS, and the system assigns a value of zero. When a concentration is detected below the method detection limit, the results are valid, and substituting values such as ½ the method detection limit or zero is not permitted (USEPA 2022o). Table 3 is not intended to be comprehensive; rather, it is meant to provide context for interpreting data. In other words, what is “normal” in each USEPA region given the canister and other bias issues is noted above in the challenges. Further technical guidance is needed for improved consistency in EtO measurements. USEPA is currently working on developing this guidance.
Having confidence in, or understanding the limitations of, sample results is also critical. Because of this, data validation is confirmed before data interpretation or use. This is an important step for all environmental measurements; however, EtO introduces unique issues that can complicate data interpretation, as discussed above. These complications include but are not limited to, the following:
-
- Stability of calibration standards—concern of EtO degradation in calibration gas cylinders (USEPA 2019d)
-
- Canister bias and compound/matrix coelutions and interferences that may affect concentrations—concern that electropolished canisters may not be suitable for EtO ambient monitoring, and that silicon-ceramic-lined canisters should be used instead (USEPA 2021c)
-
- Data set size and sample location (e.g., rural, urban) should be taken into consideration before comparing values.
Research to overcome these issues is ongoing, and better methodologies to quantify EtO are forthcoming. In the meantime, it is recommended that data validation be conducted and potential biases be accounted for in decision-making (e.g., resample in the event of anomalous results).
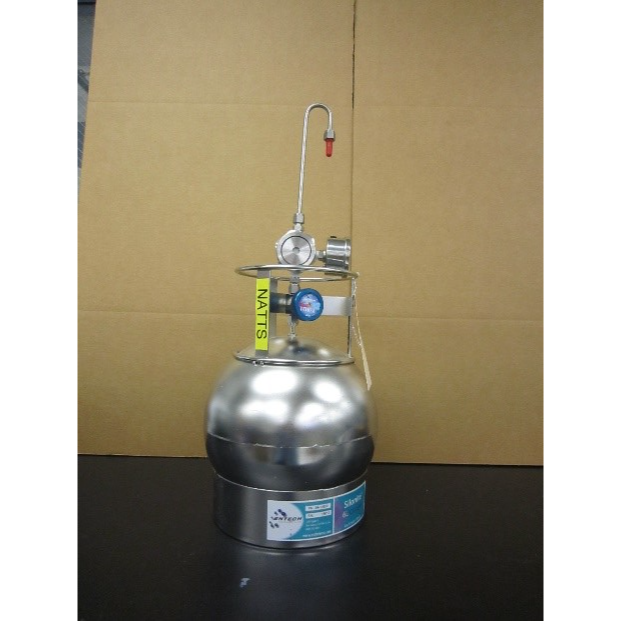
Figure 28. Can with flowhead.
Source: Batelle (2020). Used with Permission. From EPA Method TO-15A: Important Updates for the NATTS Network and Ambient Air Measurements, Battelle, June 3, 2020.

7. EtO Community Engagement Resources
Due to the concerning health effects of EtO on humans, its use in various industrial processes, and media attention, numerous federal, state, private, and public stakeholders are actively researching and analyzing EtO in the environment (Figure 31). Stakeholders include the following:
- fence-line communities, particularly those with EJ concerns
- federal regulators
- state regulators
- manufacturers and users of EtO
- people who work near facilities that use/manufacture EtO
- users of sterilized products
- employees who work in facilities using EtO
Identifying and assessing the needs of stakeholder groups is necessary for regulatory agencies to make informed decisions. Learning what information the stakeholders need, how they are likely to react to the information shared, what their potential interests/concerns are, how they will likely expect to be involved in the decision-making process, and what methods of communication are used in each community are just some of the pieces of information needed. To see whether your agency has additional EtO information, explore our interactive map. The ITRC delves into aspects of the above questions and more in the Risk Communication Toolkit (ITRC 2017b[60]ITRC. 2017b. “Risk Communication Toolkit (2017, November).” Interstate Technology and Regulatory Council, accessed June 29. https://rct-1.itrcweb.org/1-introduction/.).

Figure 31. Visualization of stakeholders involved in environmental projects.
Source: South Carolina Department of Health and Environmental Control, Office of Environmental Affairs, Community Engagement (Lawra Boyce, January 14, 2020). Used with permission.
7.1 Routes of EtO Exposure
According to the ATSDR, “People living near industrial facilities that release ethylene oxide to the outdoor air may be exposed to higher levels of ethylene oxide than people who do not live near these facilities” (ATSDR 2022c). For those that work where EtO is made or used (such as in hospitals or facilities processing certain herbs and spices), workers could be exposed to it primarily through inhalation. “These workers generally have a higher exposure to ethylene oxide than the public. Medical equipment or other items sterilized by ethylene oxide can also have very small amounts of ethylene oxide remaining many days after sterilization” (ATSDR 2022c). The FDA (2023b) recognized two voluntary consensus standards (ANSI AAMI ISO 11135:2014 and ANSI AAMI ISO 10993-7:2008(R)2012) that describe the acceptable levels of residual EtO. “Workers who do routine sterilization of medical equipment in hospitals or other workplaces may be exposed to relatively high levels (higher than other workers) of EtO see Section 7.2.3. A small amount of the total ethylene oxide used in the United States is used to remove the threat of mold, bacteria, and insects from herbs and spices, but because it breaks up into the air, only very small amounts could remain on food, if at all” (ATSDR 2022c).
Inhalation is the primary route of exposure to EtO in both occupational and environmental settings (ATSDR 2022a). People who live near facilities that release EtO to the outdoor air may also be exposed to EtO. Background EtO in the air is generally at very low concentrations, but levels may be elevated near places where EtO is produced or used. The general population also may be exposed to EtO through cigarette smoke (ATSDR 2022d, a). See Section 4.4 for additional potential sources of EtO exposure.
Workers may be exposed to EtO if they work in places where EtO is produced or used, such as chemical plants and commercial or hospital sterilizers (see Section 3.4.9). These workers potentially have higher-than-average exposure. Currently, there are set OELs and personal protective equipment (PPE) requirements that aim to protect workers (see Section 7.2.3). Per OSHA’s EtO web page, “The U.S. Environmental Protection Agency (EPA) is proposing new health protections to reduce exposure to Ethylene Oxide (EtO), including more stringent air emissions standards and additional protections for workers who are exposed to the gas used to sterilize medical devices and certain spices. These proposals provide a comprehensive approach to addressing EtO pollution concerns, including cancer risk, that increase safety in communities and for workers. For more information, see USEPA’s News Release” (OSHA 2023c).
Exposure through skin or eyes, also known as dermal and ocular exposure, respectively, may only be a risk for workers who are involved in EtO manufacturing or who use EtO in their job or during industrial accidents involving EtO ((ACC 2023b), Section 7). For those who work where EtO is made or used, exposure would primarily be through inhalation. This kind of exposure can be minimized by proper industrial health practices, including the use of PPE.
It is unlikely that EtO would remain dissolved in water or remain on food long enough to be eaten or swallowed (ATSDR 2022c, USEPA 2020c). For additional information, please refer to the Regulatory Framework section of this guide.
7.2 Tools for Learning About EtO Human Health Effects
USEPA estimates that EtO “significantly contributes to potential elevated cancer risks in some census tracts across the U.S. These elevated risks are largely driven by a change in USEPA’s risk value that was updated in late 2016” (USEPA 2018). Modeled data based on USEPA NATA data released in 2018 shows 25 out of approximately 100 operating commercial sterilizers in the country pose a maximum individual lifetime cancer risk above USEPA’s 100-in-1-million risk range (UDHHS 2022). A risk level of 100 in 1 million refers to the likelihood that 100 in 1 million (1 in 10,000) people would develop cancer if they breathed air containing a constant amount of the same toxic air pollutant for 70 years. This risk would be in addition to the lifetime cancer risk a person would have without being exposed to that toxic air pollutant. The American Cancer Society (2022) reports that the average risk for the overall U.S. population of developing cancer over a lifetime is about 39% for women and about 41% for men.
Additional information about EtO in your area can be found by using the USEPA tools listed below:
- AirToxScreen Mapping Tool—based on emissions data reported by facilities (USEPA 2023i)
- AIR Data—air quality data collected at outdoor monitors across the U.S. (USEPA 2023b)
The Air Toxics Screening Assessment (AirToxScreen) is USEPA’s ongoing review of air toxics in the United States (USEPA 2023j). USEPA developed AirToxScreen as a screening tool for state, local, and tribal air agencies. AirToxScreen’s results can help agencies identify the pollutants, emission sources, and places they may wish to study further to better understand any possible risks to public health from air toxics. The AirToxScreen tool is capable of the following:
- Providing a snapshot of outdoor air quality with respect to emissions of air toxics.
- Predicting the long-term risks to human health if air toxics emissions are steady over time.
- Estimating the cancer risks from breathing air toxics over many years. It also estimates chronic noncancer hazard for some pollutants, including diesel particulate matter.
- Calculating air toxics concentrations and risks at the census tract level.
AirToxScreen emissions data are updated periodically. Data may be updated when facilities experience reductions, corrections, or elimination of emissions. The most recent data can be obtained from the AirToxScreen Mapping Tool as it becomes available (USEPA 2023i). The AirData website provides access to air quality data collected at outdoor monitors across the United States, including two U.S. territories (Puerto Rico, and the U.S. Virgin Islands). The data come primarily from the AQS database. AirData allows the display and download of monitored hourly, daily, and annual concentration data; Air Quality Index data; and speciated particle pollution data.
7.2.1 EtO Emissions That Affect EJ Communities
Failure to address EJ concerns has led to grave consequences for low-income populations or communities with people of color. More information about the history of EJ efforts in the U.S. can be found at this website (Department of Energy). Without a voice, human health in these communities can suffer greatly as a result of poorly informed environmental decision-making (ITRC 2021). EJ is defined by USEPA at their Environmental Justice Website as “the fair treatment and meaningful involvement of all people regardless of race, color, national origin, or income, with respect to the development, implementation, and enforcement of environmental laws, regulations, and policies” (USEPA 2020a). EJ can only be achieved when everyone has “the same degree of protection from environmental and health hazards, and equal access to the decision-making process to have a healthy environment in which to live, learn, and work” (USEPA 2020a) (Figure 32 and Figure 33).

Figure 32. USEPA Administrator Michael Regan meeting with members of Mossville, Louisiana, a community with EJ concerns, in 2021.
Source: USEPA.

Figure 33. Touring a community with EJ concerns near an EtO-emitting facility.
Source: South Carolina DHEC EJ Strong Project (July 2022, Kristy Ellenberg). Used with permission.
Since its inception in the early 1980s, the field of EJ has grown to encompass a broad spectrum of other environmentally inclusive subjects, concerns, and executive orders; some of the terminology commonly used today includes social equity, social impact, and environmental equity (ITRC 2021). Signed on February 16, 1994, Executive Order 12898 officially recognized EJ on a federal level, directing agencies to focus attention on the environmental and human health effects of federal actions on minority and low-income populations (Executive Order 12898 1994). Per the executive order “In accordance with Title VI of the Civil Rights Act of 1964, each Federal agency shall ensure that all programs or activities receiving Federal financial assistance that affect human health or the environment do not directly, or through contractual or other arrangements, use criteria, methods, or practices that discriminate on the basis of race, color, or national origin” (USEPA 2023af). More recently, on January 27, 2021, Executive Order 14008 was signed (Executive Order 14008 2021). This executive order established the White House Environmental Justice Interagency Council and the White House Environmental Justice Advisory Council. Executive Order 14008 also established the Justice40 Initiative and set a goal that 40 percent of the overall benefits of certain federal investments flow to disadvantaged communities. Another milestone was met when New Jersey became the first state in the nation to adopt legislation on permitting requirements based on EJ. Signed on September 18, 2020, Senate Bill 232 requires the New Jersey Department of Environmental Protection “to evaluate the environmental and public health impacts of certain facilities on overburdened communities when reviewing certain permit applications” (Connolly, Eisenstark, and Hummel 2020). In December 2022, USEPA released eight principles to guide consideration of EJ in CAA permitting decisions (USEPA 2022e).
The National Environmental Justice Advisory Council (NEJAC), a federal advisory committee established in 1993, offers advice and recommendations about issues related to EJ and regularly provides a forum to discuss integrating EJ with other USEPA priorities and initiatives. On May 3, 2019, NEJAC addressed a letter to USEPA Administrator Andrew Wheeler expressing concern that EJ communities are disproportionately exposed to EtO and other air toxins. Specifically, the letter urged “the Environmental Protection Agency to regulate Ethylene Oxide to protect public health, particularly for the workers in these facilities and the communities living adjacent to them, who are most vulnerable to health threats from both acute chemical releases and long-term exposures” (NEJAC 2019). NEJAC recommended that USEPA use the best available science when calculating health risks associated with EtO, provide information on its emission reduction efforts, strengthen its regulatory framework, and communicate its efforts to local communities in an accessible and appropriate way.
The ITRC Risk Communication Toolkit states that a fundamental piece of risk communication is “Identifying, understanding, and engaging your audience and stakeholders. The term ‘stakeholder’ is defined broadly by ITRC as members of environmental organizations, community advocacy groups, tribal entities, or other groups that are concerned or involved with environmental issues or concerned citizens who are not a member of any organization or group” (ITRC 2017b). One tool that is used to help identify communities with EJ concerns is USEPA’s EJScreen. Learn how to use the EJScreen tool here (USEPA 2023s). USEPA uses EJScreen as a preliminary step to identify areas that may be candidates for additional consideration, analysis, or outreach as required by Executive Order 12898.
EJScreen graphically displays information on 13 environmental indicators (e.g., diesel particulate matter levels in air, lifetime cancer risk from inhalation of air toxics, hazardous waste proximity, etc.), seven socioeconomic indicators (e.g., percent of individuals who identify as people of color, low-income populations, limited-English-speaking populations, etc.), 13 EJ indexes (combination of environmental and demographic information), and supplemental indexes (USEPA 2023y). Table 4 is a guide on how to apply knowledge gleaned from EJScreen to remove demographic barriers for meaningful community involvement. The terms used in Table 4 are defined at this USEPA website (USEPA 2023y).
Table 4. Tips from EJScreen on removing demographic barriers for meaningful community involvement
| Community Demographics | Practices for Meaningful Involvement |
| People of Color |
|
| Low-Income Population |
|
| Limited-English-Speaking Population |
|
| Less Than High School Education |
|
| Population Over Age 64 |
|
Table 4 is modified from Piazza (2019).
Several additional federal tools and resources are available for EJ work, including the USEPA EnviroFacts data and the White House Council on Environmental Quality’s Climate and Economic Justice Screening Tool (Council on Environmental Quality 2022). The ATSDR released the Environmental Justice Index, which “uses data from the U.S. Census Bureau, the U.S. Environmental Protection Agency, the U.S. Mine Safety and Health Administration, and the U.S. Centers for Disease Control and Prevention to rank the cumulative impacts of environmental injustice on health for every census tract” (ATSDR 2022b).
Many states have state-specific EJ screening tools. The Alabama Department of Environmental Management (ADEM) has published a Community Engagement guide, which “highlights many of the Department’s efforts to ensure people are involved and informed regarding environmental activities in their communities” (ADEM 2022). This resource provides case-study summaries of their efforts to enhance community participation in rulemaking, permitting, compliance and enforcement, community-based practices, interagency EJ efforts, community educational practices, and more (ADEM 2022). In 2022, Michigan EGLE launched MiEJScreen, an interactive mapping tool that identifies Michigan communities that may be disproportionately impacted by environmental hazards (MI EGLE 2023).
USEPA works with the National Tribal Caucus to exchange views, information, and advice on USEPA’s tribal programs (USEPA 2023x). Their primary focus is to identify and address tribal environmental issues that are national in scope, that are cross-agency or cross-media in nature, or that may be emerging or urgent. USEPA also works with the National Tribal Air Association whose mission is to advance air quality management policies and programs consistent with the needs, interests, and unique legal status of American Indian Tribes and Alaska Natives. Additionally, USEPA partners with the Institute for Tribal Environmental Professionals to jointly manage the Tribal Air Monitoring Support Center, which is designed specifically to meet the needs of tribes involved in air quality management through training and support services.
7.2.2 State Perspective
Please refer to the Regulatory Framework section map (see Figure 4) for more information on state EtO regulations. States have various resources available. The downloadable spreadsheet includes those examples. Please refer to the map in Section 3.5 for a nationwide selection.
7.2.3 Federal Perspective
Please refer to the Regulatory Framework section map (see Figure 4) for more information on federal EtO regulations. Federal agencies have developed publicly available information on EtO, including information available at the websites listed in Table 5.
Table 5. Federal EtO resources
| Agency | EtO Web Resource |
| U.S. Environmental Protection Agency (USEPA) | Ethylene Oxide (EtO) FAQs |
| Hazardous Air Pollutants: Ethylene Oxide (EtO) | |
| Agency for Toxic Substances and Disease Registry (ATSDR) | ATSDR Clinician Brief: Ethylene Oxide |
| ATSDR’s Community Engagement Playbook | |
| Toxicological Profile for Ethylene Oxide | |
| ToxGuide for Ethylene Oxide | |
| ToxFAQs for Ethylene Oxide | |
| Occupational Health and Safety Administration (OSHA) | 1910.1047 App A—Substance safety data sheet for ethylene oxide (nonmandatory) |
| U.S. Food and Drug Administration (FDA) | FDA Continues Efforts to Support Innovation in Medical Device Sterilization |
For more information on specific regulations, please see Section 3.4.
7.2.4 Industry Perspective
As described in the introduction to this guide, EtO is produced and used for various purposes. Due to its high flammability, potential for explosive vapor decomposition, and the exothermic nature of its reactivity, companies that make and work with EtO need to take precautions related to its safe use, handling, and distribution as well as emission reductions (ACC 2022, 2023b, [Sections 5–8]).
A variety of EtO emission-generating facilities are regulated under USEPA’s NESHAP rules of the CAA as detailed in the Regulatory Framework Section. These regulatory standards require the “installation of control devices to reduce emissions, emissions monitoring, performance testing, site-specific operating parameters,” and recurring reporting and recordkeeping to ensure compliance with the NESHAP rules (ACC 2022). These industries are working with states and federal agencies to reduce emissions and install required control technologies. See the Emissions Control section for more information.
Per USEPA, the following EtO emissions facts have been reported (USEPA 2022p):
- From 2012 to 2021, stack and fugitive releases of EtO decreased by 142,000 pounds (−48%). This was caused by reductions in air releases in manufacturing operations.
- Two chemical manufacturers in Texas reported that they had large one-time (nonproduction-related) releases of EtO to air in 2018 and 2019. These one-time emissions caused the increase from 2017 to 2018 and the decrease in 2019 and 2020.
Inside production facilities, worker exposures to EtO are reduced by improved equipment designs, engineering controls, and operational protocols as well as PPE in cases where OELs could be exceeded. Employers must provide PPE to employees who may be exposed to EtO (ACC 2023b). Worker EtO exposure is monitored annually via blood testing for biomarkers, which are produced from all biogenic and anthropogenic exposure sources including at the workplace. Biomarkers includes the widely used analyses for hemoglobin EtO adducts (specifically 2- hydroxyethylvaline) (HEV) and HEMA. The American Conference of Governmental Industrial Hygienists (ACGIH) (ACGIH 2018a) has set Biological Exposure Indices or BEI values of 5,000 pmol HEV/g globin and 5 µg HEMA/g creatinine, respectively, for nonsmoking workers. These BEI values do not create an unreasonable risk of disease or injury at or below the 8hour airborne exposure equivalent of 1 ppm EtO and consider cumulative exposure from all routes (ACGIH 2018b). For workers in facilities where EtO is present, NIOSH (NIOSH 2022), the ACGIH (ACGIH 2023), and OSHA (OSHA 2023d) have set OELs, which are listed in Table 6; see Section 7.1 for information on proposed worker standards.
Table 6. EtO occupational exposure limits by organization
| Organization | Description | Averaging Period | Concentration | |
| ppm | mg/m3 | |||
| OSHA | Permissible exposure limit | 8 hours | 1 | 1.8 |
| Excursion limit | 15 minutes | 5 | 9 | |
| ACGIH | Threshold limit value | 8 hours | 1 | 1.8 |
| NIOSH | Recommended exposure limit | 10 hours | 0.1 | 0.18 |
| Ceiling | 10 hours | 5 | 9 | |
| Immediately dangerous to life or health concentrations | 10 minutes/day | 800 | 1,441 | |
| CalOSHA | Permissible exposure limit | Immediate* | 1 | 1.8 |
| Short-term exposure limit | 15 minutes | 5 | 9 | |
* Immediately dangerous to life or health limits were based on debilitating effects that might occur as a consequence of a 30minute exposure so workers would have an adequate amount of time to exit from a particular worksite, but immediate exit is advised.
Notes: ACGIH = American Conference of Governmental Industrial Hygienists, CalOSHA = California Division of Occupational Safety and Health, mg = milligrams, m = meter, NIOSH = National Institute for Occupational Safety and Health, OSHA = Occupational Safety and Health Administration, ppm = parts per million.
7.3 Stakeholder Engagement
7.3.1 Resources for Addressing Community Concerns
Regulators must provide accessible resources on EtO that address community concerns so that fair and meaningful public involvement can be provided. Web pages, fact sheets, infographics, slide decks, social media tool kits, posters, videos, etc. can be used to educate the public about EtO, and may include the following information:
- the known estimated health risks
- state and federal initiatives implemented to reduce EtO emissions
- unknowns about EtO
- monitoring data collected to date
Two fact sheets that were created as handouts for community members are shown below. One was for a meeting in Laredo, Texas, in September 2022 (Figure 34 and Figure 35), and one was for a meeting in North Charleston, South Carolina, in December 2019 (Figure 36 and Figure 37). Please refer to the Regulatory Framework section map (see Figure 4) for information on additional state EtO resources.
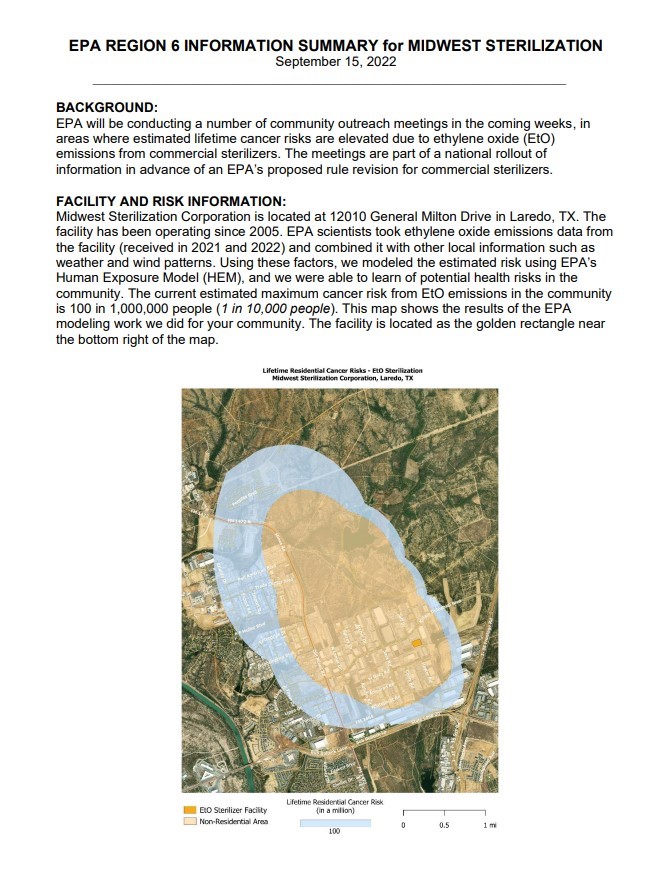
Figure 34. Page 1 of a USEPA EtO fact sheet sent to communities ahead of informational meetings in Laredo, Texas, in 2022.
Source: USEPA.
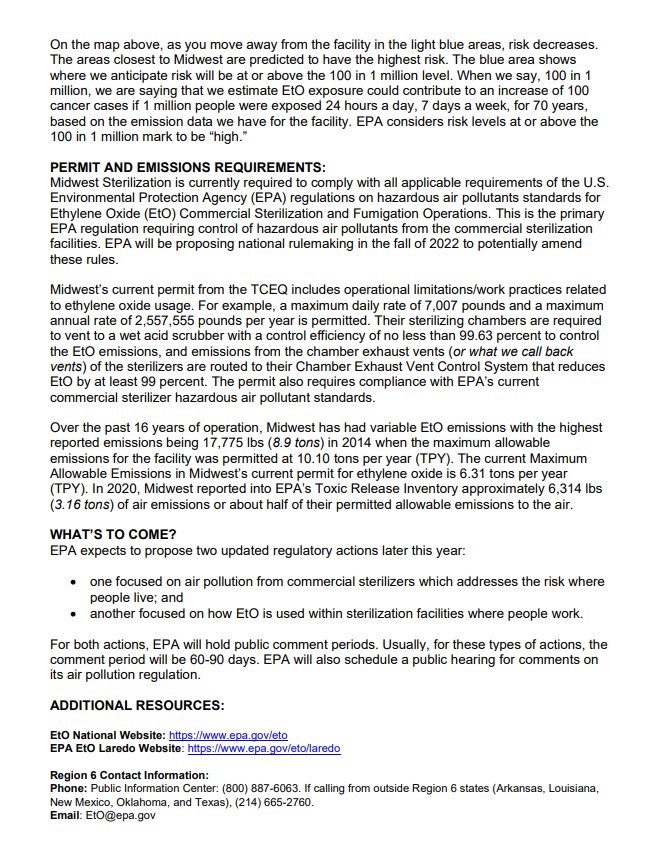
Figure 35. Page 2 of a USEPA EtO fact sheet sent to communities ahead of informational meetings in Laredo, Texas, in 2022.
Source: USEPA.
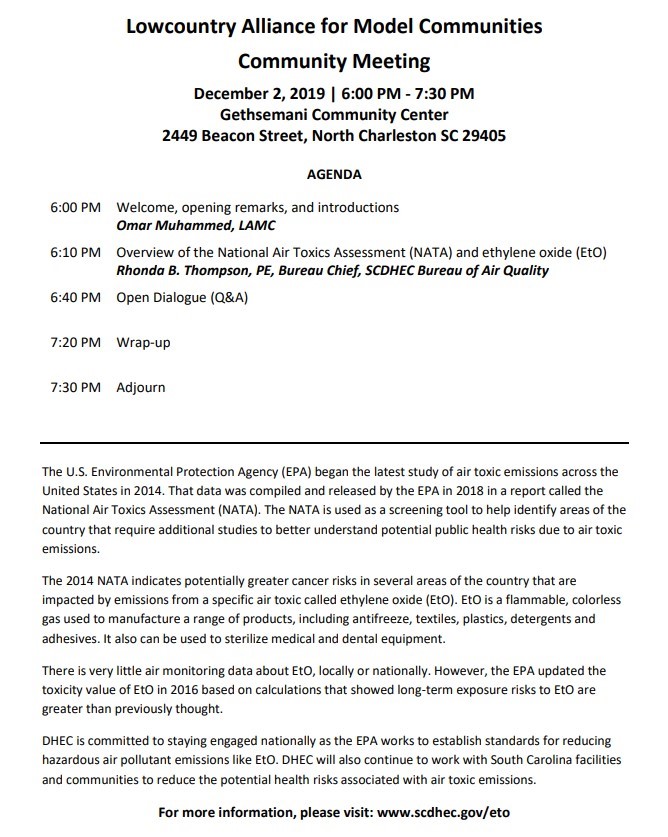
Figure 36. Page 1 of an agenda for a community-wide educational event on EtO in South Carolina.
Source: South Carolina DHEC. Used with permission.
Figure 37. Page 2 of an agenda for a community-wide educational event on EtO in South Carolina.
Source: South Carolina DHEC. Used with permission.
8. Appendix
The purpose of this appendix is to summarize the current understanding of the biogenic sources of EtO. At this time, the contribution of these biogenic sources is not completely understood by the scientific community.
8.1 Secondary Formation of Ethylene Oxide in Mammals
In mammals, the metabolic pathway for EtO creation is conversion of ethylene to EtO through enzymes such as cytochrome P450, specifically monooxygenases. EtO reacts with biological macromolecules (DNA and proteins) or is enzymatically detoxified (via glutathione transferases or epoxide hydrolases) to mercapturic acid metabolites and MEG; MEG can be further metabolized in the body. Where EtO is present in ambient air and inhaled, 20–25% of the EtO is immediately exhaled in breath as an unchanged compound, and 75–80% is metabolized (IARC 2012) (Figure 38).
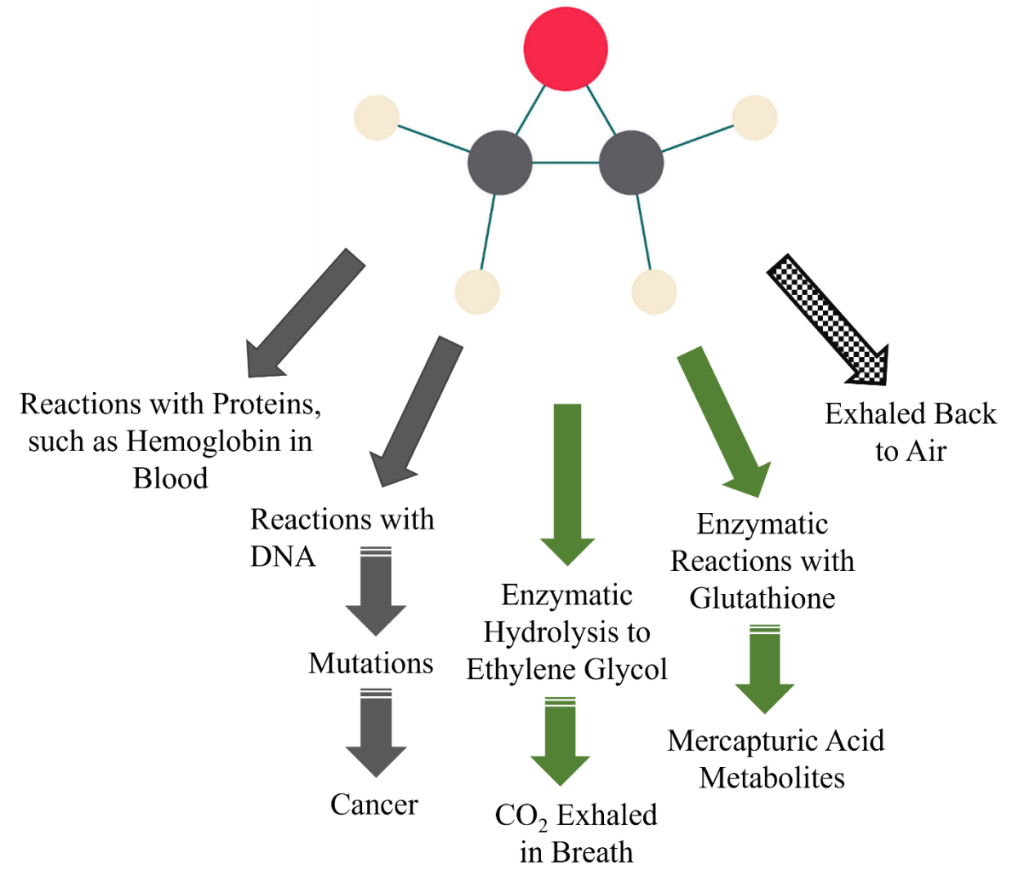
Figure 38. Fate of EtO in the human body.
On top, ball-and-stick representation of EtO molecule: 1 (red) oxygen atom, 2 (gray) carbon atoms, 4 (beige) hydrogen atoms. Arrows are not to scale. Solid gray arrows represent pathways subject to the initial biochemical reactions of EtO. Solid green arrows represent biological pathways that are detoxification mechanisms against EtO reactivity. Striped solid arrows represent additional biological steps between the biological events presented. The checkered black-and-white arrow represents a physiological process of respiration. Metabolites are mostly excreted in urine (including mercapturic acid metabolites) or exhaled as carbon dioxide. For more information on EtO fate in the body, please refer to ATSDR (2022d) and Kirman and Hays (2017).
Source: Joanna Klapacz/DOW. Used with permission.
8.2 Metabolism of Ethylene to Ethylene Oxide in Higher Plants and Microbes
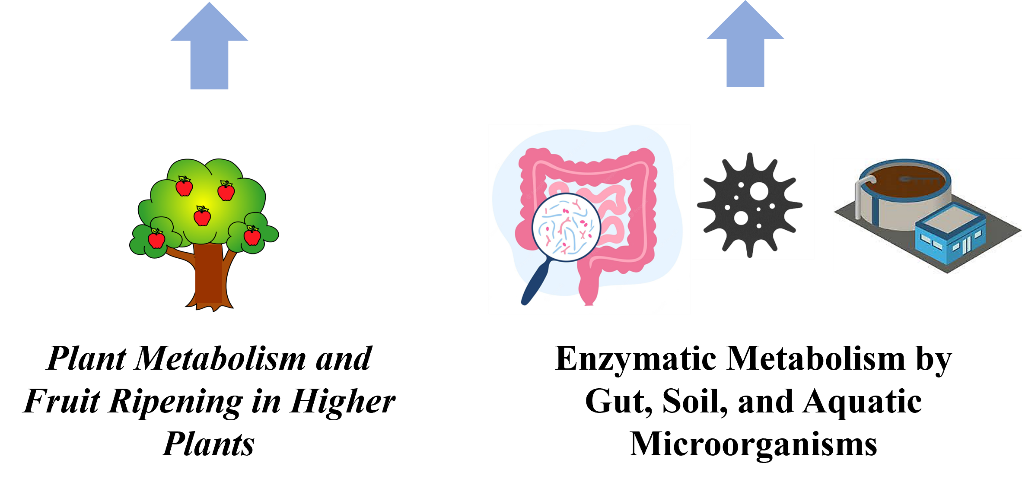
Figure 39. Plant and microbial sources of primary and secondary EtO.
Arrows are not to scale and do not represent equivalence in contributions. Secondary sources of EtO are italicized. These biological sources are documented in the literature. Please see these references for more information: plant metabolism/fruit ripening (Beyer 1984), soil and aquatic microorganisms (Morgott 2015), and gut microbes (Bolt 1996, Ehrenberg and Törnqvist 1995, Törnqvist et al. 1989).
Source: Joanna Klapacz/DOW. Used with permission.
8.2.1 Ethylene to Ethylene Oxide Metabolism in Vascular Plants
Ethylene is a well-known plant hormone synthesized by vascular plants during plant development, in plant senescence, in responses to environmental stimuli, and as a result of stress (Imaseki 1999, Ya’acov, Halevy, and Frenkel 1986).
In higher plants (e.g., flowering or fruiting plants), most tissues produce ethylene at different rates depending on their developmental stages (Figure 39) (Imaseki 1999). From seed germination to the early stages of seedling growth, a moderate level of ethylene is generally produced. When leaves or flower petals senesce, ethylene production increases, and shortly before their abscission, a transient burst of production occurs. Immature fruits produce low amounts of ethylene, but when fruits enter the ripening stage, a large amount of ethylene is produced while other organs maintain low rates of production.
When tissues are physically wounded or stressed, infected by pathogens, or injured by toxic chemicals, a large increase in ethylene production occurs near the damaged cells to regenerate new protective tissues and to heal the damaged parts (Imaseki 1999).
Knowledge of ethylene metabolism has economic importance because it is relevant to the shelf-life of fresh fruits and vegetables and cut-flower longevity and wilting (Ya’acov, Halevy, and Frenkel 1986).
Plant metabolism results in the oxidation of ethylene to carbon dioxide (CO2), EtO, MEG, oxalic acid, MEG-glucose conjugate, and other metabolites (Beyer 1984). The rate of ethylene metabolism and the type and distribution of products produced depend on the tissue, stage of development, and exposure conditions. In some plant tissues, CO2 is the predominant gas produced; in others, both CO2 and EtO are released into the air (Beyer 1984). The oxidation of ethylene to EtO is enzymatic and involves monooxygenase enzymes. EtO may increase the plant’s sensitivity to ethylene and, at high concentrations, arrest growth and development (Beyer 1984).
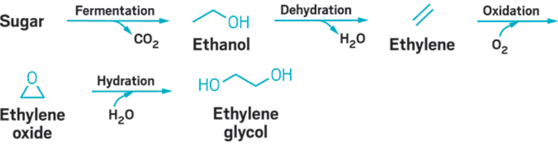
Figure 40. Microbial production/fermentation of ethylene to ethylene oxide.
Source: Tullo (2017). Used with permission.
Bio-based approaches for the generation of renewable feedstocks such as ethylene, EtO, and MEG are being considered (Faveere et al. 2021). Figure 40 illustrates the generation of these feedstocks via microbial fermentation from biomass.
8.2.2 Soil and Marine Microorganisms
Microbes found in soils and marine sediments have been recognized as one of the two primary biogenic sources of ethylene in air (Morgott 2015); the other is higher plants. Numerous soil microorganisms have been shown to generate ethylene under anaerobic conditions, and fungi can produce it under aerobic conditions. Ethylene production typically occurs at rhizosphere sites found near plant roots (Smith 1976). The rate of microbial ethylene production is influenced by many factors including soil moisture content and depth, temperature, organic matter such as leaf litter, and pH (Morgott 2015). Morgott (2015) has estimated that soils containing the highest organic carbon content generally produce most ethylene and that leaf litter contributes 0.01 – 0.48 × 10¹² grams of ethylene per year globally. Some soil bacteria consume ethylene as a carbon and energy source via the enzymatic oxidation pathway (Van Ginkel, Welten, and De Bont 1987, Wiegant and De Bont 1980). Generally, ethylene production has been found to exceed consumption rates in the soil from evergreen forests whereas the ratio is more variable in deciduous forests (Morgott 2015, Zechmeister-Boltenstern and Smith 1998). Some bacteria can oxidize ethylene to EtO but are unable to further metabolize EtO. These bacteria have received considerable attention as potential bioreactors for bioproduction of epoxides (De Bont et al. 1983).
Seawater levels of ethylene have been linked to bacterial metabolism, natural gas seepage, phytoplankton release, and seaweed growth and are affected by factors such as sunlight, temperature, and dissolved organic matter (Morgott 2015). Ethylene is also produced by a variety of green, red, and brown algae, and it appears to have the same biological functions in the algae as in higher terrestrial plants (Broadgate et al. 2004, Plettner, Steinke, and Malin 2005).
8.2.3 Gut Microbiome
The association between intestinal bacteria and endogenous ethylene/EtO exposure has long been established in laboratory animals and humans based on steady-state levels of the N-terminal valine amino acid modifications of blood hemoglobin protein with EtO to form 2hydroxyethylvaline (HEV) (Bolt 1996, CDC 2022, Ehrenberg and Törnqvist 1995, Reitjens et al. 2022, Törnqvist et al. 1989). These data suggest that the biomarker levels of hemoglobin modification that are formed, as indicated by HEV, are similar among species studied, including humans (Bolt 1996). The seminal study conducted by Törnqvist and colleagues (1989) indicated that endogenous EtO is produced by intestinal bacteria and through peroxidation of unsaturated lipids. In germ-free laboratory animals, an endogenous level of HEV has been reported and linked to the ethylene biosynthesis from a methionine amino acid precursor in microbes, higher plants, and animals (Pattyn, Vaughan-Hirsch, and Van de Poel 2021, Törnqvist et al. 1989). Based on NHANES data, this reaction could be relevant to humans (CDC 2022, Reitjens et al. 2022).
Published by the Interstate Technology & Regulatory Council, December 2023

